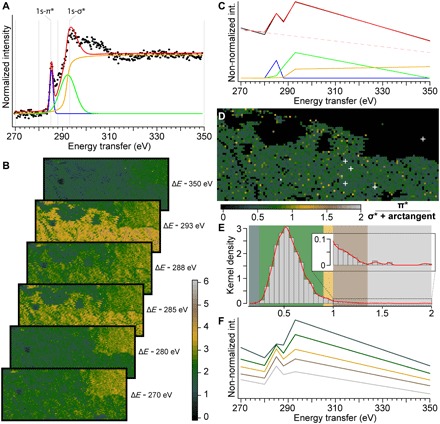
Fig. 2. 2D XRS carbon K-edge speciation mapping of a fragment of Lepidodendron trunk from the Upper Carboniferous (ca. 305 Ma ago) of Noyelles-lez-Lens, France.

(A) Spectral decomposition in two Gaussians and an arctangent of edge features of the normalized background-corrected XRS carbon K-edge XANES spectrum from the location indicated as point “2” in Fig. 1D. (B) Carbon intensity maps collected at 270, 280, 285, 288, 293, and 350 eV from the solid box area in Fig. 1D (scan step, 300 μm by 300 μm; 6000 pixels; beam size, 15 μm by 15 μm). Note how accurately the intensities in the fossils match the full spectra collected and how the intensities decrease following the Compton scattering background in the shale. (C) Spectral decomposition of the reduced spectrum collected at the exact same location as spectrum point “2” in (A) and Fig. 1D. (D) Distribution of the (1s-π*)/(1s-σ* + arctangent) ratio within the Lepidodendron trunk (calculated from the spectral decomposition of the reduced spectrum at each pixel). The white crosses indicate the location of the full spectra shown in Fig. 1E. (E) Histogram and kernel density of the ratio, allowing to pinpoint a few pixels with a speciation different from the full spectra collected. (F) Mean (reduced) spectra from the different classes of ratio identified by their respective colored boxes in (E).
