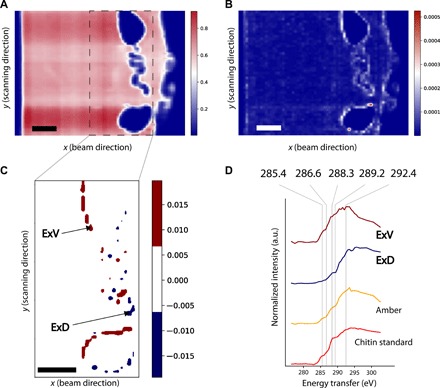
Fig. 4. XRS virtual cross section and spectra of an Eocene ant entrapped in amber from Oise (France, ca. 53 Ma old).

(A) Total intensity virtual cross-sectional image (pixel size, 50 μm; beam size, 10 μm by 20 μm) of the ant entrapped in the Eocene amber (image with interpolation). (B) Spatial distribution of the quadratic error showing the diverse chemical regions of the sample when performing a fit based on the amber reference (image with interpolation). (C) Spatial distribution of Achit when performing a fit based on the reference compounds amber and chitin (image with interpolation). (D) From top to bottom, distinctive normalized mean XRS spectral profiles corresponding to the ventral (Achit > 0.007, ExV) and the dorsal (Achit < −0.007, ExD) areas of the exoskeleton, as indicated with the arrows in (C), Oise amber collected from the bulk specimen (amber), and chitin standard used as a reference material (chitin standard). Scale bars, 500 μm.
