
Fig. 6. Results of the magnitude estimation test.
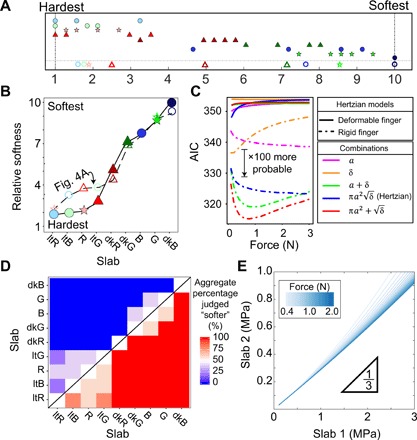
(A) Participants (n = 5) ranked slabs on a numerical scale of perceived softness, where the distance between slabs indicated relative levels of perceived softness. A “1” indicated the hardest sample and a “10” represented the “softest” sample. Hollow symbols at the bottom represent average values; solid markers represent participant responses. Slabs were judged on a scale of 1 to 10 with 33 discrete locations. (B) Participant response on the number line test as compared to a two-alternative forced-choice test. (C) Predictive power of different Hertzian models and combinations of indentation depth and contact area. The scale bar denotes a 100-fold increased probability of a model fitting the data from an incremental change in AIC. A linear increase in the differences in AIC between two models represents an exponential increase in probability. (D) Individual, head-to-head comparisons from the magnitude estimation test. (E) Curve representing the ratio between the Young’s modulus of two slabs so that slab 2 feels twice as soft as slab 1. Slab 1 is shown for different Young’s moduli (Eq. 8) and at applied forces similar to human touch.