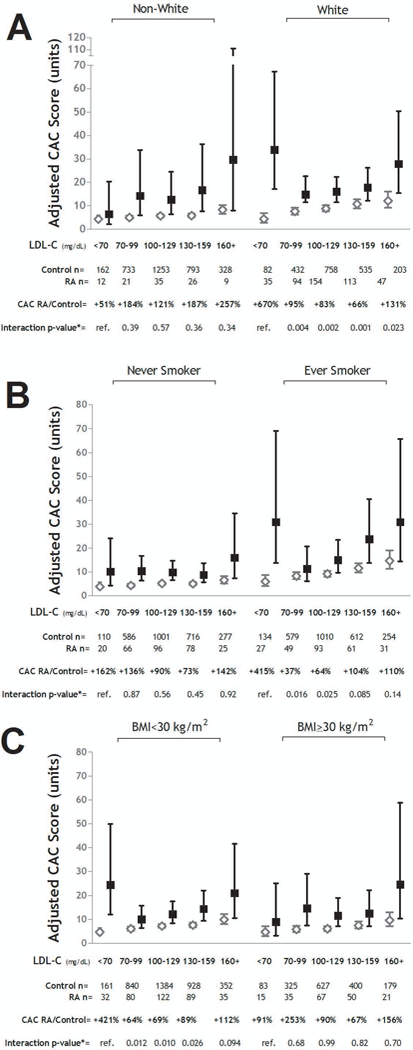
Figure 2. Adjusted Coronary Artery Calcium Levels According to LDL-C Strata Stratified by Race, Smoking, and Body Mass index: RA vs. Control.

Graphs depict adjusted mean CAC scores and 95% confidence intervals (CIs) for strata of LDL-C for the RA vs. control groups stratified by White Race (Panel A), ever smoking (Panel B), and obesity (i.e. BMI≥30 mg/m2)(Panel C). Relative differences in CAC scores for the RA vs. control groups are indicated per stratum. Interaction p-values compare the relative difference in CAC between the RA and control groups for the given stratum compared with the lowest (referent) stratum. For all panels, models were adjusted for age, sex, race (where appropriate), waist circumference, smoking (where appropriate), diabetes, hypertension, HDL-C, and aspirin use
