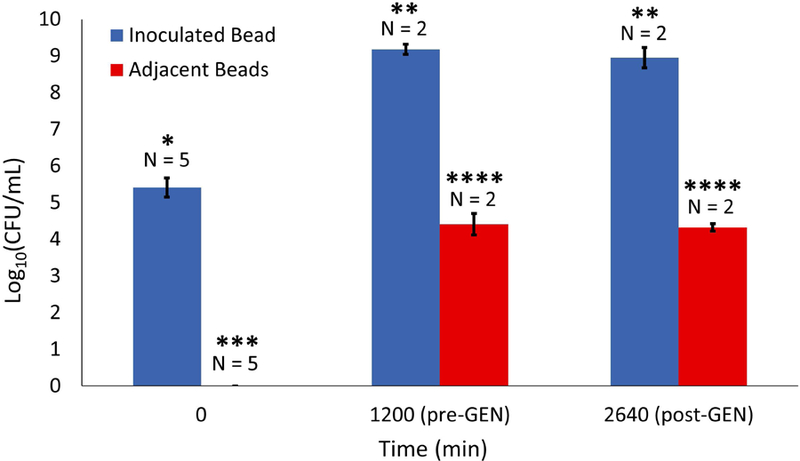
Figure 5.

Viable cell counts for inoculated bead (blue) and adjacent beads (red) at beginning of experiment, immediately prior to GEN treatment, and after 24 hours of GEN treatment. Error bars represent standard deviation and asterisks denote significant differences.
