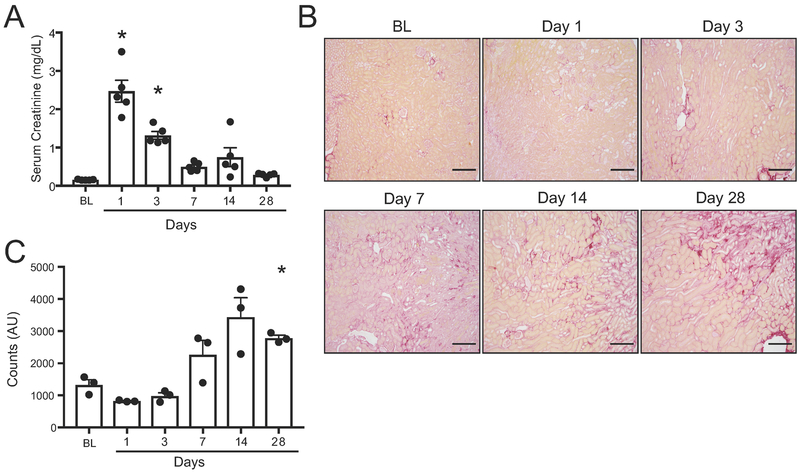
Figure 1. Renal ischemia/reperfusion (I/R) induces kidney injury and subsequent fibrosis.
(A) Serum creatinine levels were measured and expressed as milligrams/deciliter at baseline and on days 1, 3, 7, 14, 28 following I/R. Data are expressed as means ± SEM; *P < 0.05 vs baseline. (B) Picrosirius red stain demonstrating collagen deposition at various time points following injury. (C) Quantification of collagen deposition by measuring intensity of picrosirius stain encompassing positive staining areas above threshold. Data are expressed as means ± SEM; *P < 0.05 vs baseline. Scale bar= 200μm.

