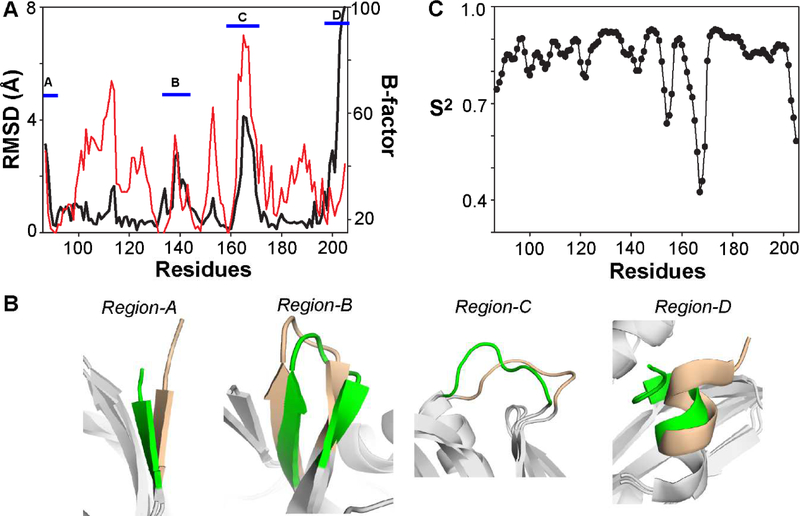
Figure 3.
Conformational plasticity of 1918 NS1-ED. (A) Black line corresponds to the backbone (Cα) RMSD between the NMR and crystal structures of 1918 NS1-ED. Red line corresponds to the Cα B-factor of the crystal structure. The four regions that have a large RMSD between the two structures are marked using blue bars. (B) Superimposed structures of four conformationally plastic regions in the 1918 NS1-ED. NMR and crystal structures are shown in green and wheat, respectively. Other regions in both structures are shown in gray. (C) RCI-derived order parameters of the 1918 NS1-ED.

