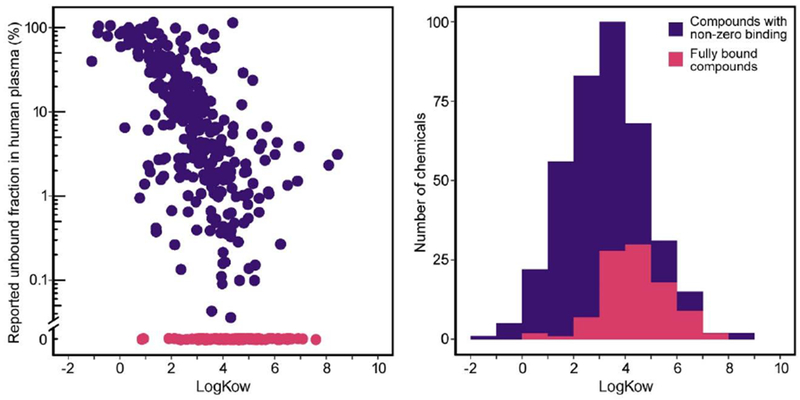
Figure 1.

Relationship between logKow and unbound fraction in RED by Wetmore et al. (Wetmore, 2015; Wetmore et al., 2012). having non-zero unbound fractions in purple and those with zero human plasma measured using A. Scatter-plot with chemicals unbound fractions in magenta and shown along the lower x-axis. B. Histogram distribution of logKow values from panel A overall (purple), and for the subset with zero measured unbound fractions shown in magenta.
