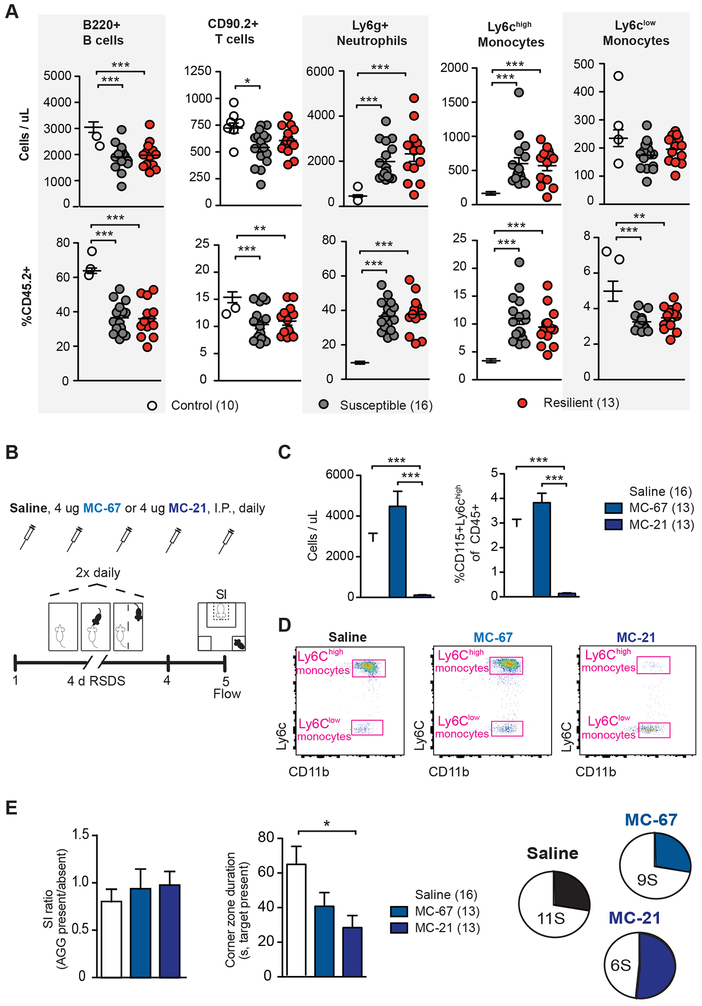
Figure 1. Role of Ly6chigh monocytes in behavioral response to repeated social defeat stress.
(A) Absolute counts (top) and relative frequencies (bottom) of B cells, T cells, Neutrophils, Ly6chigh monocytes, and Ly6clow monocytes in peripheral blood 48 hours post repeated social defeat stress (RSDS). (B) Experimental timeline of 4-day accelerated RSDS, daily injection of saline, MC-21 anti-CCR2 antibody or MC-67 isotype control, social interaction (SI) testing, and flow cytometry analysis (flow). (C) Depletion of Ly6chigh monocytes in peripheral blood by daily injection of MC-21, shown as a decrease in absolute count (left) and frequency (right). (D) Representative flow scatter plots of blood from Saline (left), MC-67 (middle), and MC-21 (right) treated mice. (E) MC-21 treated mice showed a nonsignificant increase in social interaction ratio compared to the saline treated group (left). MC-21 mice spent less time in the corner zones than saline treated mice when the target was present (middle). Whereas saline and MC-67 groups showed an approximately 1:2 ratio of resilience to susceptibility, MC-21 treated mice showed a roughly 1:1 ratio (right). For bar graphs, data represent mean + SEM. For dot plots, data represent mean ± SEM. The number of animals (n) within each group is indicated below graphs. *p<0.05, **p<0.01, ***p<0.0001 (one-way ANOVA with Tukey’s post hoc tests [A, E].

