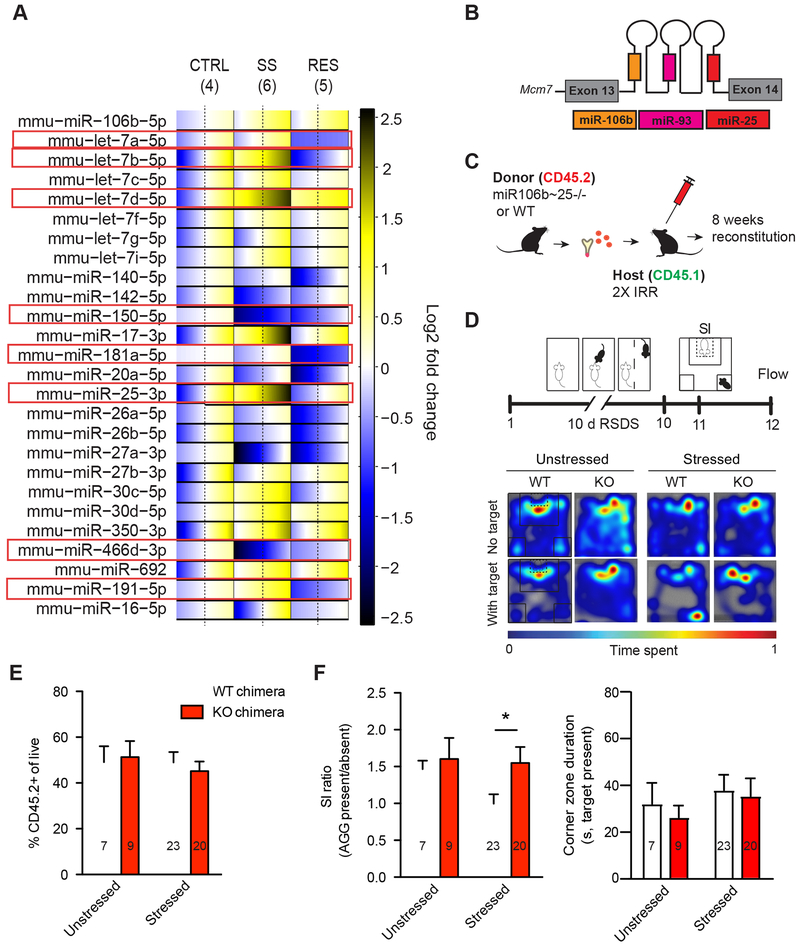
Figure 2. Peripheral knockdown of miR-106b~25 cluster promotes behavioral resilience to repeated social defeat stress (RSDS).
(A) microRNA profiling in Ly6chigh monocytes 48 hours after RSDS. Heatmap illustrating normalized expression pattern of detectable microRNAs (miRs) in resilient (right) and susceptible mice (middle) relative to unstressed controls (left). The range of colors indicates individual differences within each group (standard error of the mean, SEM) from the average, which is represented by a dashed line. Blue indicates lower expression, yellow indicates increased expression, and white indicates no change. (B) Schematic of the polycistronic miR-106b~25 cluster. (C) Schematic illustrating the generation of miR-106b~25−/− bone marrow chimeras. (D) Experimental timeline of 10-day RSDS, social interaction (SI) testing, and flow cytometry. (E) % CD45.2+ cells in WT and miR-106b~25−/− chimeras showing no differences in level of chimerism. (F) Social interaction ratios in stressed and unstressed WT and miR-106b~25−/− chimeras. 106b~25−/− chimeras exhibited significantly higher social interaction ratios than stressed WT chimeras and no differences in corner zone duration. Representative heat maps of social interaction tests are shown on the top right. For bar graphs, data represent mean + SEM. The number of animals (n) within each group is indicated on the graphs. *p<0.05 (two-way ANOVA with Bonferroni post hoc test).

