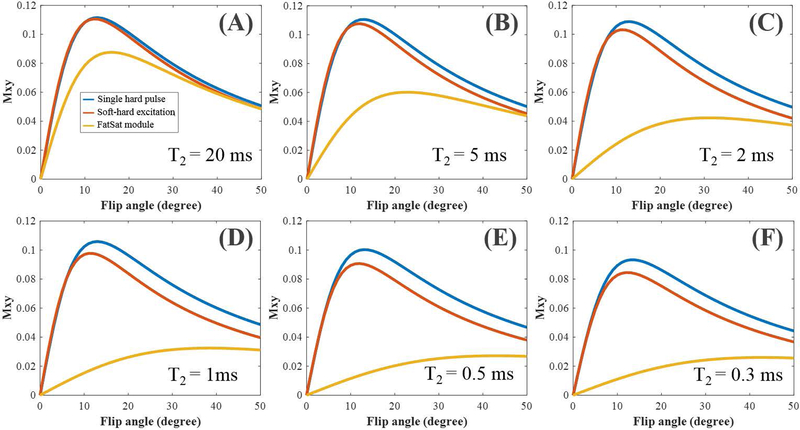
Figure 3.
Simulations of UTE imaging using the excitations with a single hard pulse (blue curves), the proposed soft-hard composite pulse (red curves), and the conventional FatSat module (yellow curves), respectively. The UTE signal intensities changed with the flip angles ranged from 0° to 50°. Six different T2s of 20, 5, 2, 1, 0.5, and 0.3 ms were used to simulate both long and short T2 tissues. All the tissue T1s were set to a constant value of 800 ms for simulation.

