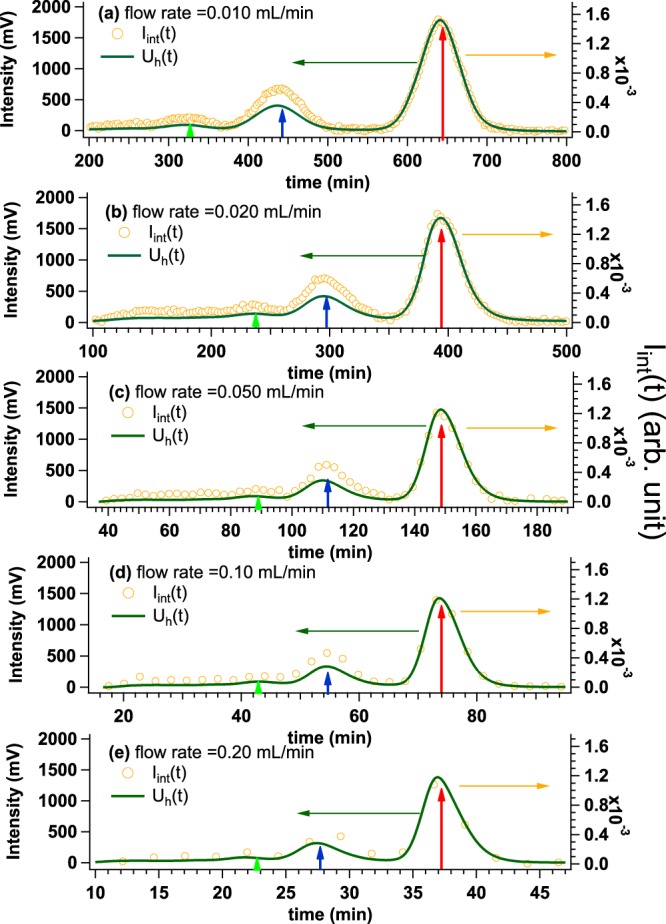
Figure 3.

Time evolutions of UV intensity at 280 nm from HPLC (green line) (Uh(t)) and SAXS integrated intensity (Iint(t)) (yellow circle) at the flow rate of (a) 0.010 mL/min, (b) 0.020 mL/min, (c) 0.050 mL/min, (d) 0.10 mL/min and (e) 0.20 mL/min obtained by injecting BSA solution with the initial concentration and the volume of 5.4 mg/mL and 500 μl, respectively. Three peaks were observed from UV-HPLC, of which peak positions are highlighted by light green, blue and red arrows from the higher molecular weight component to the lower one.
