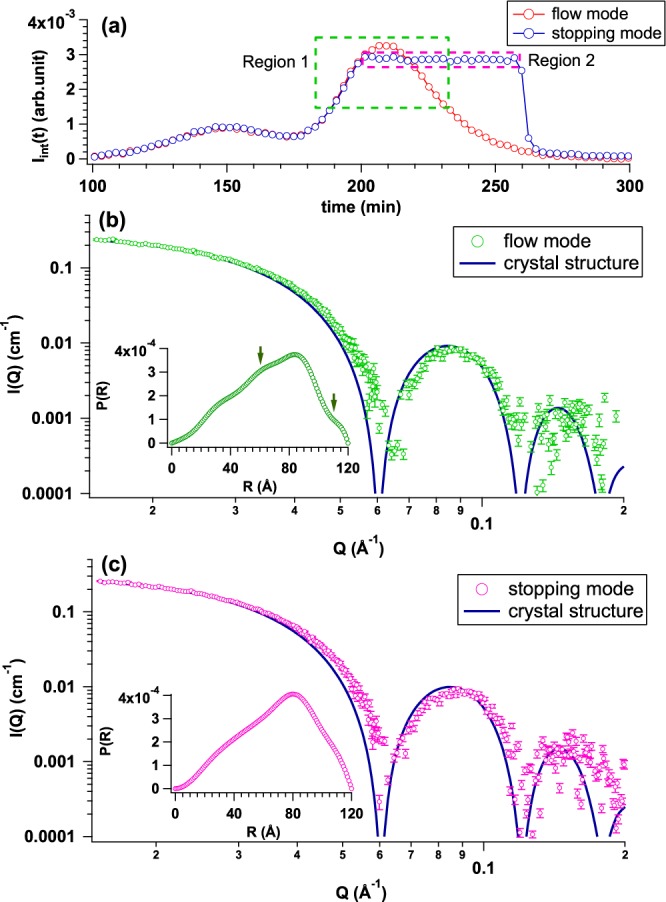
Figure 6.

(a) Time evolutions of integrated SAXS intensity (Iint(t)) from flow mode (red circle) and stopping mode (blue circle) by applying AF solution with the initial concentration and the volume of 5.1 mg/mL and 500 μl, respectively. We selected two regions; Region 1 (highlighted by green dotted rectangle) and Region 2 (highlighted by pink dotted rectangle) for obtaining averaged SAXS profiles. (b) Averaged SAXS profile from the Region 1 (green circle) in (a) and calculated SAXS profile based on crystal structure (blue curve). Inset shows P(R) calculated from averaged SAXS profile. P(R) from the flow mode is slightly oscillating due to insufficient data quality, as shown by green solid arrows. (c) Averaged SAXS profile from the Region 2 (pink circle) in (a) and calculated SAXS profile based on crystal structure (blue curve). Inset figures show P(R) functions calculated from averaged SAXS profiles.
