
Figure 8.
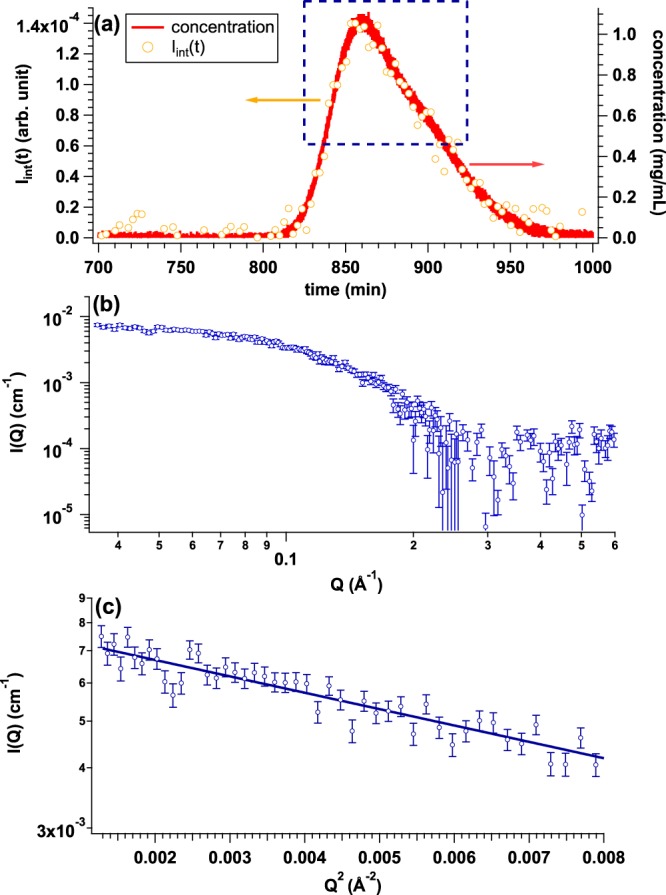
(a) Time evolutions of integrated SAXS intensity (Iint(t)) (yellow circle) and concentration calculated from Uc(t) (UV-SAXS-cell: red line) by injecting PNGase-PUB solution with the initial concentration and the volume of 2.7 mg/mL and 300 μl, respectively. We selected a region at t = 860 min highlighted by blue dotted rectangle for obtaining averaged SAXS profile. (b) Averaged SAXS profile from the region highlighted by blue dotted rectangle in (a). (c) Guinier plot of averaged SAXS profile (Rg = 15.3 ± 0.5 Å).