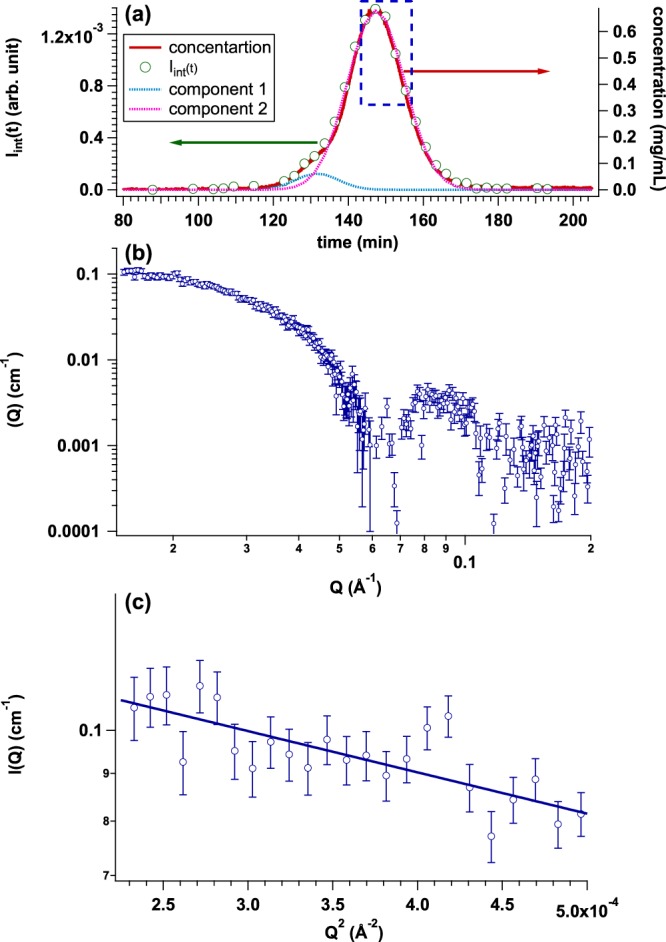
Figure 9.

(a) Time evolutions of integrated SAXS intensity (Iint(t)) (green circle) and concentration calculated from Uc(t) (UV-SAXS-cell: red line) by injecting AF solution with the initial concentration and the volume of 5.1 mg/mL and 50 μl, respectively. Two Gaussians are used for the description of Iint(t) and dotted curve corresponds to each component: light blue (component 1) and pink (component 2), respectively. (b) Averaged SAXS profile from the region highlighted by blue dotted rectangle in Fig. 8(a,c) Guinier plot of averaged SAXS profile (Rg = 55.2 ± 3.8 Å).
