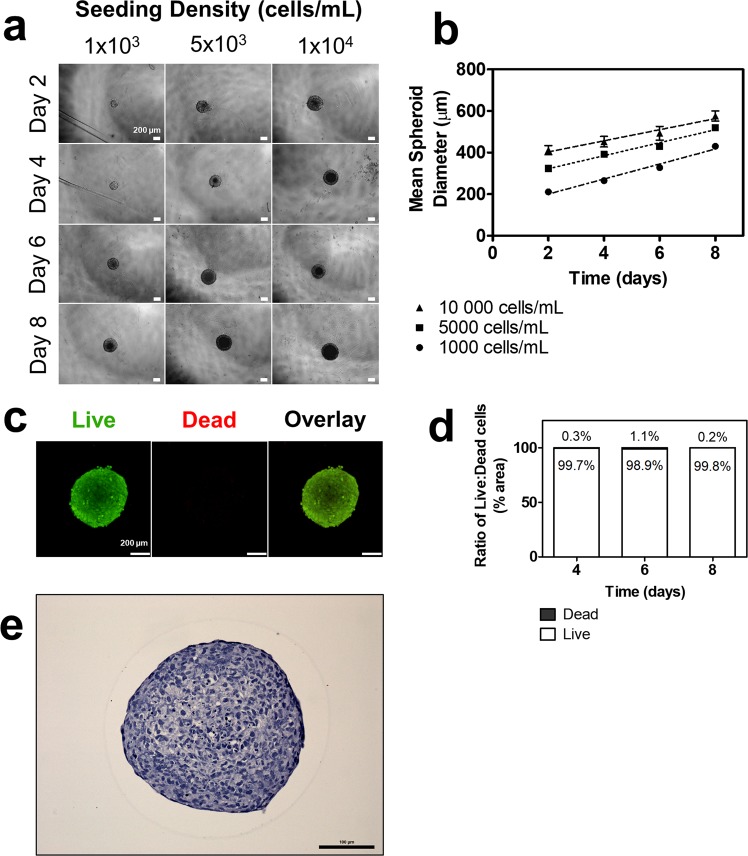
Figure 1.
Self-assembly, growth, and viability of 3D EVT spheroids over eight days. (a) EVTs seeded at three different densities form spheroids that increase in size over eight days. 4x magnification. Scale bar indicates 200 µm. (b) Mean spheroid diameter over time across three seeding densities. (c) Immunofluorescent images of live and dead stain using calcein AM and ethidium homodimer-1, respectively. Green colour indicates live cells. Red colour indicates dead cells. 10x magnification. Scale bar indicates 200 µm. (d) Ratio of surface area of live to dead cells at days four, six, and eight. (e) Representative image of H&E staining of a spheroid cross-section. Scale bar indicates 100 µm. n = 3.

