Figure 5.
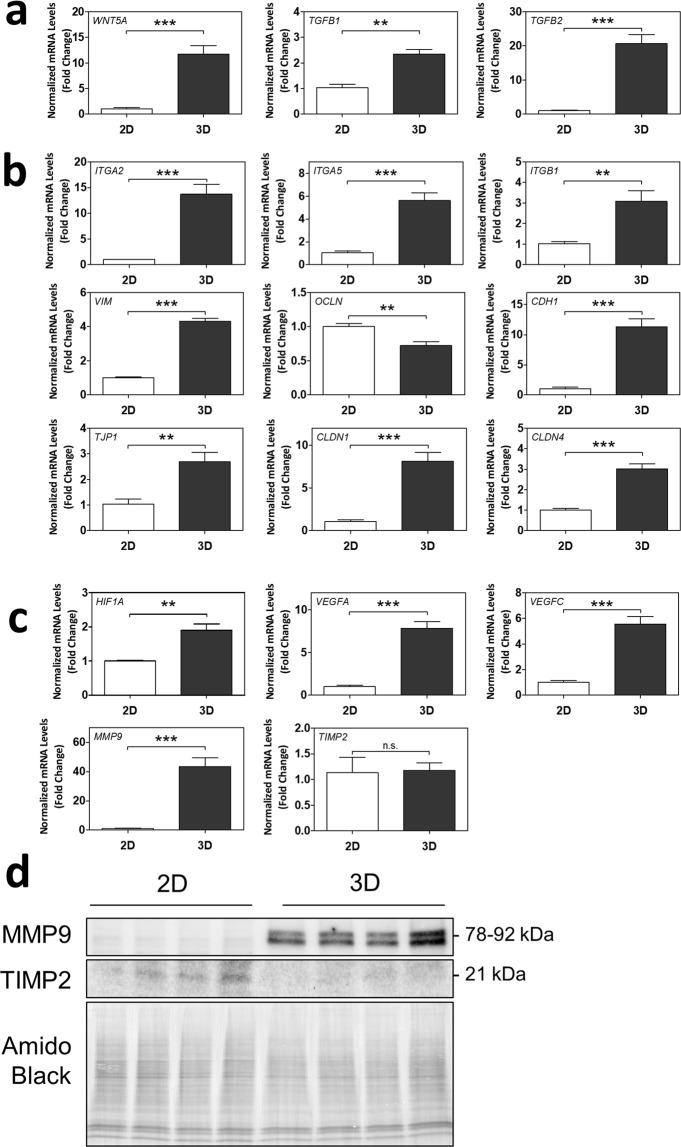
3D spheroids exhibit differential mRNA and protein expression of markers of epithelial-mesenchymal transition (EMT), cell-cell contact, angiogenesis, and invasion/migration. Normalized mRNA levels of (a) WNT5A, TGFB1, TGFB2, (b) ITGA2, ITGA5, ITGB1, VIM, OCLN, CDH1, TJP1, CLDN1, CLDN4, (c) HIF1A, VEGFA, VEGFC, MMP9, and TIMP2, as measured using RT-qPCR. Significant differences between groups determined by unpaired t-test; n = 4. Significant differences between means were indicated by **(p < 0.01) or ***(p < 0.001). Non-significant differences indicated by n.s. (d) Cropped blots of MMP9 and TIMP2 protein bands as detected by Western blot, and Amido Black staining of total protein. n = 4. Membrane was cut below 63 kDa and top half used for the MMP9 blot. Remaining membrane was cut above 25 kDa and lower half used for the TIMP2 blot. Whole blots with protein ladders found in Supplementary Fig. S1.

