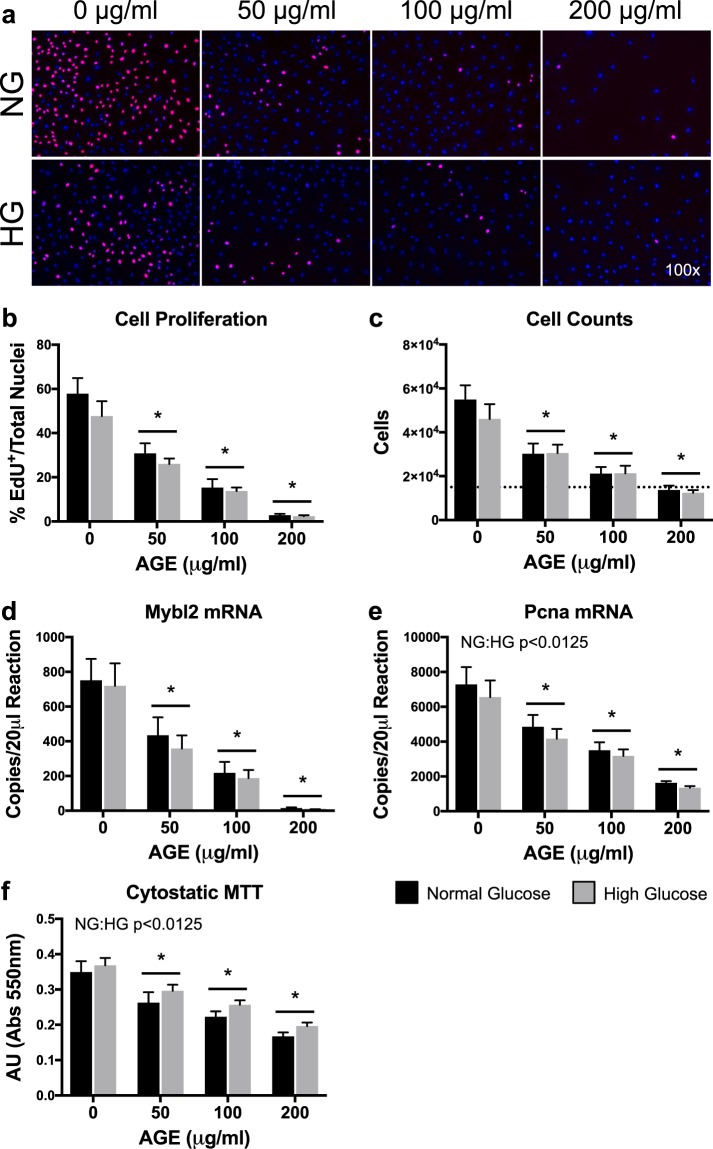
Figure 1.
Proliferative Capacity (n = 8). (a) Representative images of EdU+/DAPI overlay after 48 hours of AGE treatment. EdU+ nuclei are pink and have active DNA synthesis. Blue nuclei (DAPI) do not have active DNA synthesis. (b) Graphical representation of EdU images (Panel A). Data represented as ratio of EdU+ nuclei to total nuclei. (c) Cell counts after 48 hours of AGE treatment. Dashed line represents initial seeding density of 15,000 cells. (d,e) ddPCR gene transcript counts for Myb-related protein B (Mybl2) and proliferating cell nuclear antigen (Pcna). (f) Cytostatic MTT shown as absolute arbitrary absorbance units. *p < 0.0125 main effect for AGE vs. AGE-0 μg/ml, mixed effects regression. NG:HG p < 0.0125 indicates main effect for glucose condition, mixed effects regression. Data presented as mean ± standard error. ■ Normal Glucose (NG),  High Glucose (HG).

