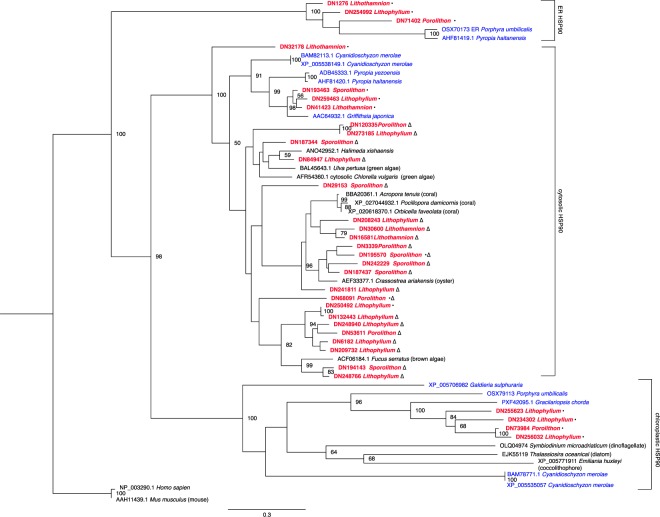
Figure 7.
Best scoring maximum likelihood phylogenetic analysis of heat shock protein 90 sequences. Clade containing Mus musculus and Homo sapiens endoplasmic reticulum (ER) HSP90 was used as the outgroup. Bootstrap values <50 removed. Scale bar indicates the branch length for 0.3 aa substitutions. CCA names are shown in bolded red and other noncalcifying red algae species are in blue. •Denotes HSP90 genes found in CCA that were highly similar to G. chorda (PXF42095) chloroplastic HSP90 sequence from BLASTP transcriptome analysis. ∆denotes HSP90 sequences that were within the enriched category of ‘supramolecular fibre organisation’. •∆Denotes sequences that were returned from both analyses.

