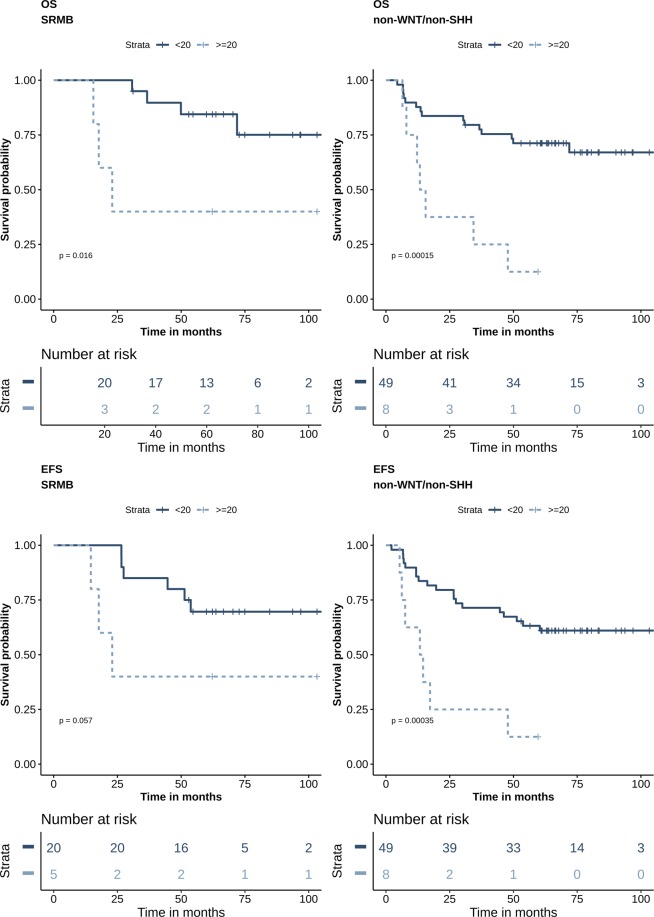
Figure 2.
Aggresomes predict poor outcome among standard risk and non-WNT/non-SHH patients. Survival analysis Kaplan-Meier according to percentage of aggresomes within the tumor cells. (A) Patients are stratified according to clinicopathological risk criteria. (B) Patients are stratified using molecular subgrouping. Survival probability (y axis) and time indicated in months (x axis). p-values were calculated using the log-rank test.

