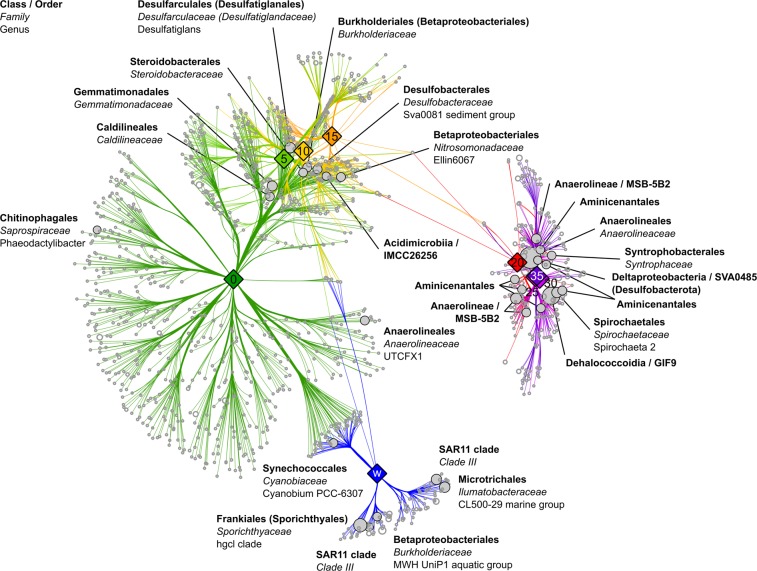
Fig. 2.
Bacterial genera associated with the different depths of the sediment cores and water column. The association network was calculated with the indicspecies54 package in R and visualised in Cytoscape with an edge-weighted spring embedded layout. Branch lengths indicate the phi correlation coefficient. Each light grey circle indicates a bacterial genus associated (p < 0.001) with the depth it is connected to. The 30 most abundant genera are indicated by filled circles and named up to the point where the classification turns to uncultured. Revised names according to Parks et al.28 are indicated in brackets. Average relative abundance of each genus among all samples is indicated by the circle size. Each sampling depth is indicated by a filled diamond shape containing the depth in cm or w (water column).

