Fig. 6.

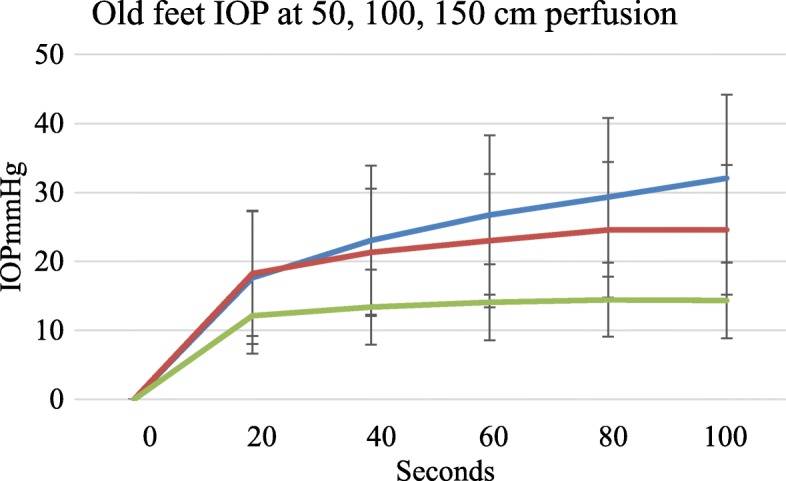
Older feet had a different filling curve profile with continued perfusion. They become increasingly oedematous with no obvious IOP end point. Blue = 150 cm, Red = 100 cm, Green = 50 cm perfusion pressure, error bars SD

Older feet had a different filling curve profile with continued perfusion. They become increasingly oedematous with no obvious IOP end point. Blue = 150 cm, Red = 100 cm, Green = 50 cm perfusion pressure, error bars SD