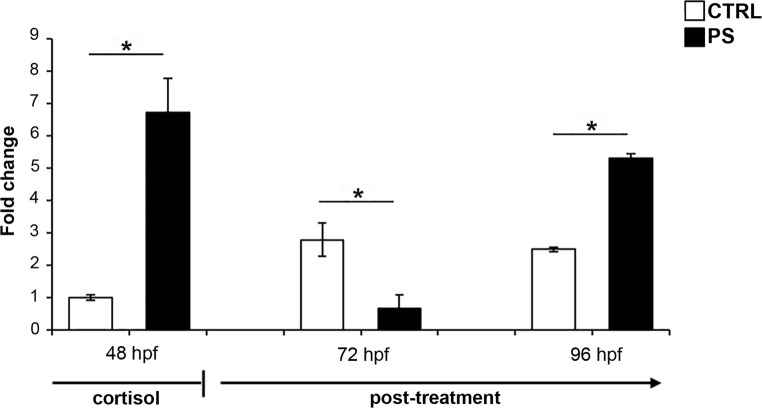
Fig. 2.
mRNA expression pattern by means of RT-qPCR for hsd11b2 gene in prenatal stress condition. The analysis was carried out at different developmental stages indicated as hours post-fertilization (hpf). The mRNA level was reported as fold change by using actb2 as a reference gene and control 48 hpf embryos as a calibrator. CTRL, control embryos/larvae; PS, prenatally stressed embryo/larvae. Data are reported as mean ± SEM. *Significant differences as determined by REST2009 (P < 0.05)

