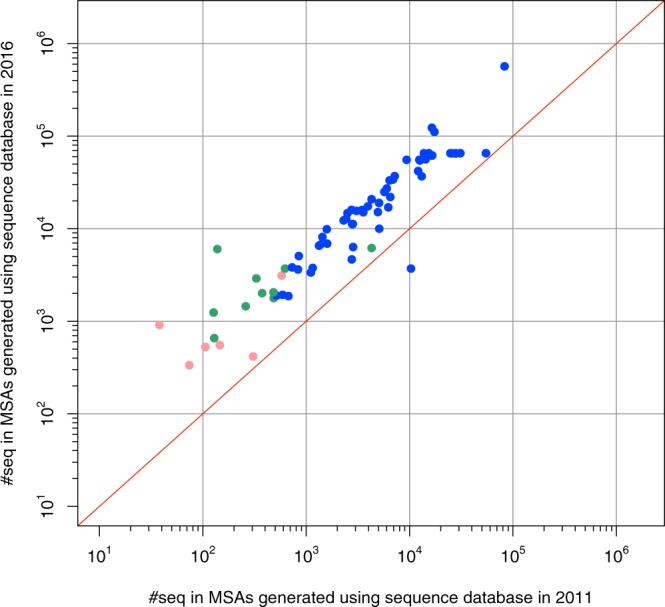
Figure 1.

Comparison of the numbers of sequences included in MSAs. The X-axis shows the numbers of sequences in MSAs generated using the sequence database of 2011; the Y-axis shows those using the sequence database of 2016. Monomers in the Duarte dataset were compared. Dots show each monomer. Blue dots represent both 2011 and 2016 MSAs satisfying the diversity requirement of PSICOV. Green dots represent only 2016 MSAs satisfying the requirement. Pink dots represent neither 2011 nor 2016 MSAs satisfying the criterion.
