
Figure 1.
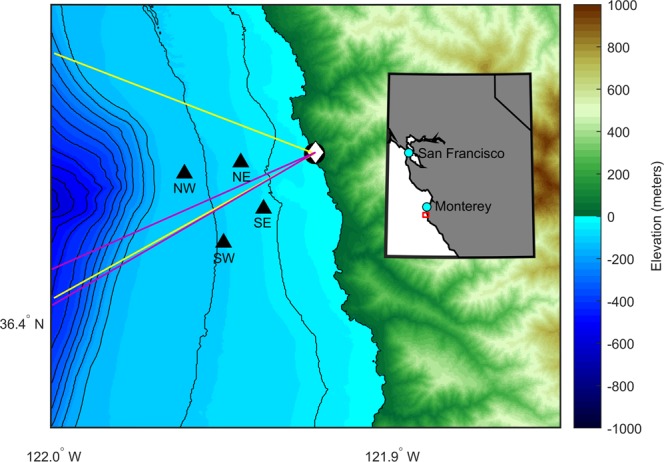
Map of the study area for the combined visual, infrared, and acoustic survey of migrating gray whales. The black circle indicates the location of the visual observers and the white diamond indicates the location of the infrared camera. The four black triangles indicate the locations of the four hydrophones and are labelled according to their positions. The visual field of view is shown with yellow lines and the infrared field of view is shown with pink lines. Colours indicate the land elevation and seafloor depth with respect to sea level and the black contour lines show the seafloor depth in 50 m increments. Bathymetry data are from the NOAA National Centers for Environmental Information’s Southern California Coastal Relief Model with 1 arc-second resolution. The latitude bounds are 36.375°–36.475°N and the longitude bounds are 122.000°–121.850°W. For reference, the SE hydrophone is about 1.5 km from shore and the NW hydrophone is about 3.6 km from shore.