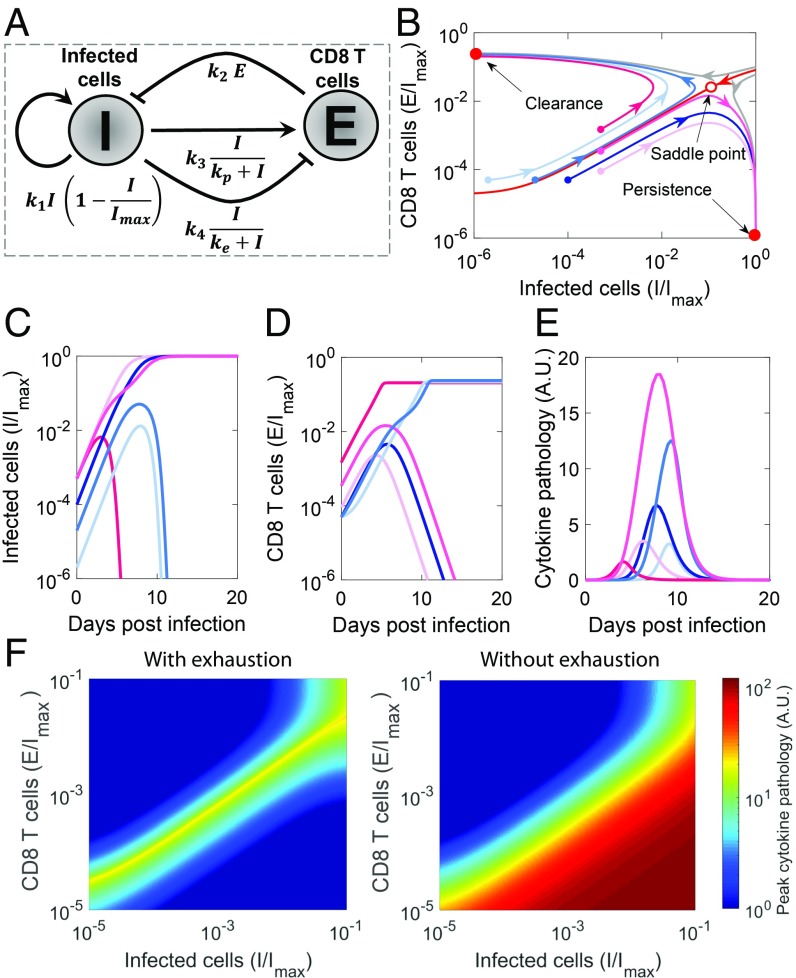
Fig. 1.
Dynamical motif underlying the outcomes of viral infections. (A) Schematic of the motif depicting the essential interactions between infected cells, , and CD8 T cells, . (Note that arrows and blunt arrows imply positive and negative regulation, respectively.) (B) Phase portrait of the system, where regions leading to the 2 stable steady states (filled red dots), clearance and persistence, are separated by a basin boundary (red line). The unstable saddle (open red dot) underlies immunopathology. Also shown are trajectories with increasing initial antigen load (light to dark blue) and increasing initial effector pool size (light to dark pink) and the corresponding time course of (C) infected cells, (D) effector pool size, and (E) pathology. (F) Heat maps of peak pathology for different initial conditions on the phase portrait with and without exhaustion. Parameters values are in SI Appendix, Table S1.

