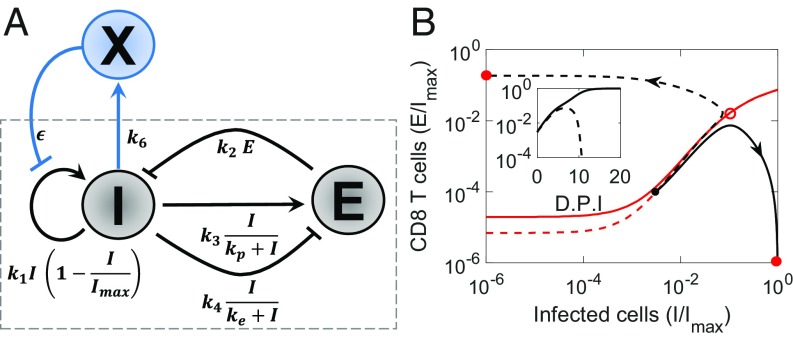
Fig. 4.
Influence of the innate immune response. (A) Schematic of the motif with the embellishment representing the innate immune response, . (B) Projections of trajectories and time evolution of pathogen load (Inset) with strong (dashed) and weak (solid) innate immune responses. D.P.I., days post-infection. Red lines represent the projections of the corresponding basin boundaries. Three-dimensional versions are in SI Appendix, Fig. S4. Parameters values are in SI Appendix, Table S1.

