Fig. 5.
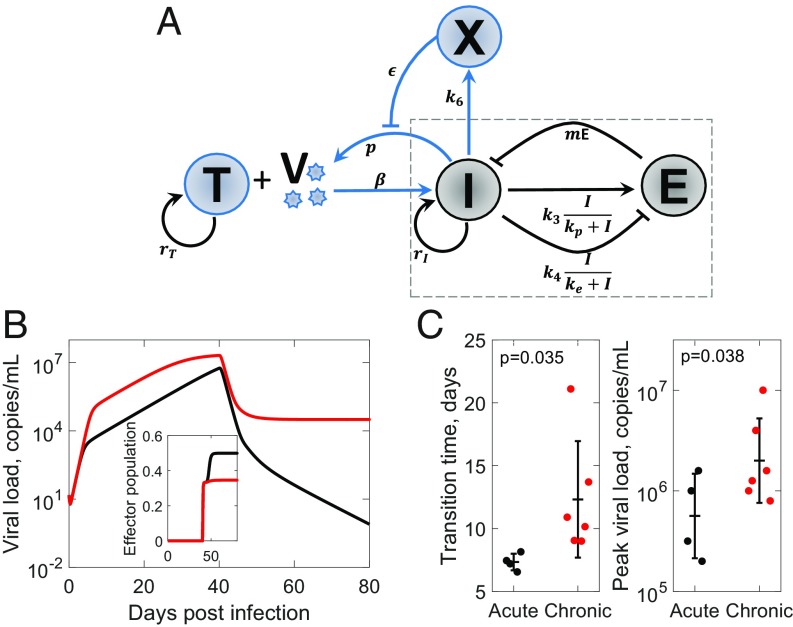
Innate immune response and the outcomes of HCV infection. (A) Schematic of the motif including viral dynamics. (B) Time course of viral load and (Inset) effector pool size for strong (black) and weak (red) innate immune responses. Parameters used are given in SI Appendix, Table S2. (C) Experimental observations (37, 38) of (Left) transition time from the first- to second-phase rise of viremia and (Right) peak viral load in chimpanzees infected with HCV resulting in clearance (black) or persistence (red) of the infection. One-tailed t tests with equal variance yielded P values.

