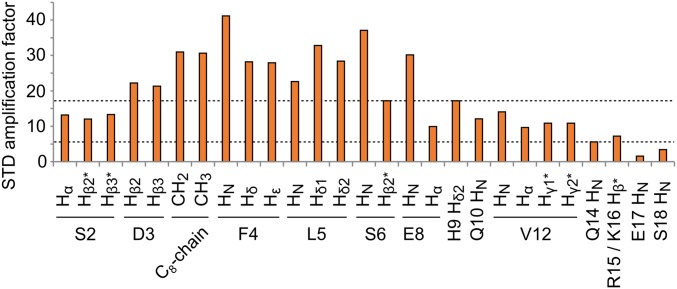
Fig. 4.
Map of the area of interaction of ghrelin with its receptor. STD amplification factors of ghrelin bound to GHSR, with ASTD = (I0 − Isat)/I0 × [ghrelin]/[GHSR] (24). This number indicates the efficiency of magnetization transfer from the receptor to the peptide. It depends on the proximity of receptor and peptide protons, as well as on the internal dynamics of the complex. The difference in amplification factors in the absence and presence of JMV5327 is plotted here. Backbone amide protons and other protons signals were identified from 2D 15N-1H and 1D 1H STD experiments, respectively. An asterisk indicates signals for which stereospecific assignment was not performed. Dashed lines indicate the medium-intensity STD signal of S6 Hβ and the low-intensity STD signal of Q14 HN. The STD signal of G1-Hα is similar to the STD signals of S2-Hα and S2-Hβ; however, its amplification factor could not be measured precisely due to partial overlap with other signals in 1D proton spectra.

