Fig. 5.
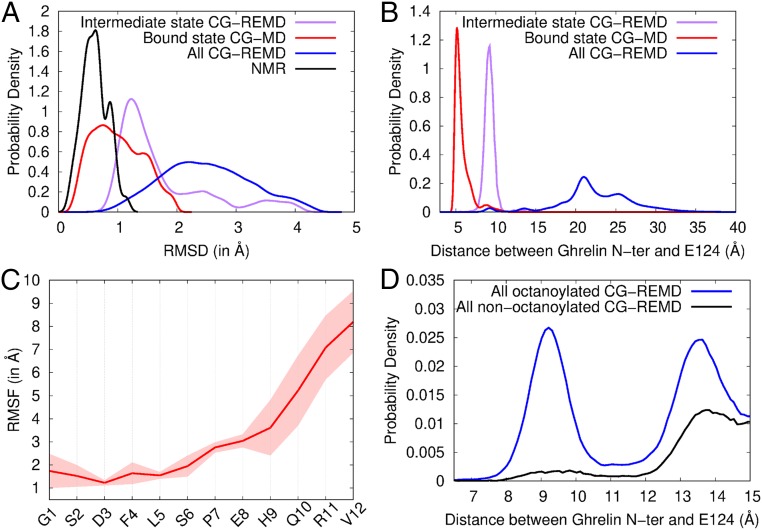
Conformation and flexibility of ghrelin bound to GHSR. (A) Root mean square deviation (RMSD) profiles of coarse-grained models from the ensemble of NMR structures (black), the bound state model (red), the intermediate state model (purple), and all models in contact with GHSR from CG-REMD simulations (blue). The RMSD is a measure of structural deviation from a reference structure, here the NMR structure ensemble. (B) Probability densities of the distance between the ghrelin N terminus and the side chain bead of E1243.33 in the different models. (C) Root mean square fluctuation (RMSF) profile of ghrelin backbone during restrained CG-MD simulations. The RMSF shows the variability in position of each residue along the trajectory (Movie S2). Conformations were aligned on the receptor pocket to account for the global flexibility of ghrelin inside its binding cavity. The SD inferred from the 2 CG-MD simulations is shown as a transparent area around the mean (red line). (D) Probability densities of the distance between octanoylated and nonoctanoylated ghrelin N termini and the side chain bead of E1243.33. Densities are shown from 6.5 Å to 15 Å for clarity. Complete density profiles are provided in SI Appendix, Fig. S11.

