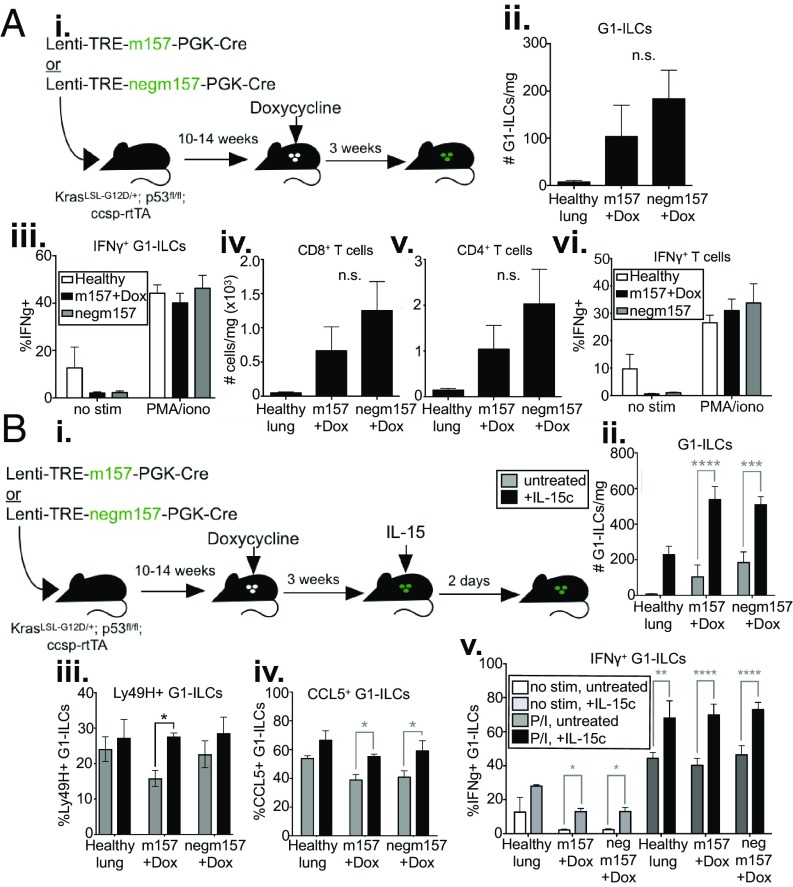
Fig. 5.
Stimulated NK cell responses are short-lived, can be boosted by IL-15. (A, i) KP; ccsp-rtTA mice were infected intratracheally with Lenti-TREm157 or Lenti-TREnegm157, initiating tumor formation. Mice with established tumors were placed on a Dox diet, inducing ligand expression, until tissues were harvested. Mice were killed and tumors harvested 3 wk later. (ii) Quantification of G1-ILC numbers in m157/cre +Dox tumors, compared to negm157/cre +Dox tumors, and healthy lung tissue, by flow cytometry, gated on NK1.1+;CD8−;CD4− cells. n = 5 mice per condition (3 for healthy lung), mean ± SEM. P = 0.3312. (iii) IFN-γ production by G1-ILCs in m157/cre +Dox tumors (black bars), compared to negm157/cre +Dox tumors (gray bars), and healthy lung tissue (white bars), by flow cytometry, gated on NK1.1+;CD8−;CD4− cells. The percentage of cytokine+ cells in the absence of stimulation (no stim) or in the presence of PMA and ionomycin (PMA/iono) is shown. n = 5 mice per condition (3 for healthy lung), mean ± SEM. P = 0.9738. Quantification of (iv) CD8+ T cell, and (v) CD4+ T cell numbers in m157/cre +Dox tumors, compared to negm157/cre +Dox tumors, and healthy lung tissue, by flow cytometry, gated on CD8+ or CD4+ cells, respectively. n = 5 mice per condition (3 for healthy lung), mean ± SEM. P = 0.3655, 0.3357, respectively. (vi) IFN-γ production upon ex vivo stimulation by T cells in m157/cre +Dox tumors (black bars), compared to negm157/cre +Dox tumors (gray bars), and healthy lung tissue (white bars), by flow cytometry, gated on CD8+ and CD4+ cells combined. The percentage of cytokine+ cells in the absence of stimulation (no stim) or in the presence of PMA and ionomycin (PMA/iono) is shown. n = 5 mice per condition (3 for healthy lung), mean ± SEM. P = 0.6221. (B, i) KP; ccsp-rtTA mice were infected intratracheally with Lenti-TREm157 or Lenti-TREnegm157, initiating tumor formation. Mice with established tumors were placed on a Dox diet, inducing ligand expression, until tissues were harvested. Three weeks later, IL-15 was administered intratracheally; 2 d later, mice were killed, and tumors harvested. Quantification of (ii) G1-ILC numbers, (iii) %Ly49H+ G1-ILCs, and (iv) G1-ILC CCL5 staining in m157/cre +Dox tumors with (black bars) and without (gray bars) IL-15 treatment, compared to negm157/cre +Dox tumors, and healthy lung tissue, by flow cytometry, gated on NK1.1+;CD8−;CD4− cells. n = 5 mice per condition (2 to 3 for healthy lung), mean ± SEM. (ii) P < 0.0001, 0.0007, (iii) P = 0.00128, (iv) P = 0.0241, 0.0115, respectively. (v) IFN-γ production after ex vivo stimulation by G1-ILCs from IL-15 treated lungs (darker bars), compared to untreated lungs (lighter bars), in Lenti-TREm157 or Lenti-TREnegm157 tumor-bearing lungs or healthy controls, by flow cytometry, gated on NK1.1+;CD8−;CD4− cells. The percentage of cytokine+ cells in the absence of stimulation (no stim, light gray and white bars) or in the presence of PMA and ionomycin (PMA/iono, black and dark gray bars) is shown. n = 5 mice per condition (2 for healthy lung), mean ± SEM. P = 0.05, 0.05, 0.0085, < 0.0001, < 0.0001, respectively. See also SI Appendix, Fig. S5. *P < 0.05; **P < 0.01; ***P < 0.001; ****P < 0.0001. n.s., not significant.

