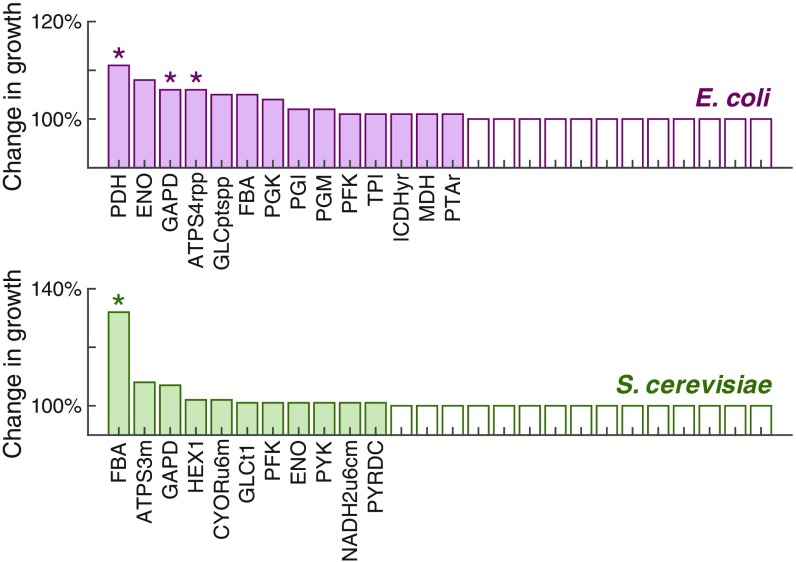
Fig. 6.
Predicted change in growth rate after doubling turnover rate of each reaction in the models. The x axis only presents the reactions that can affect growth rate. Reaction ID is consistent with that in Datasets S1 and S2. The asterisk represents experimental evidence for the reaction: PDH (45), DAPD (46), ATPS4rpp (47), and FBA (48).

