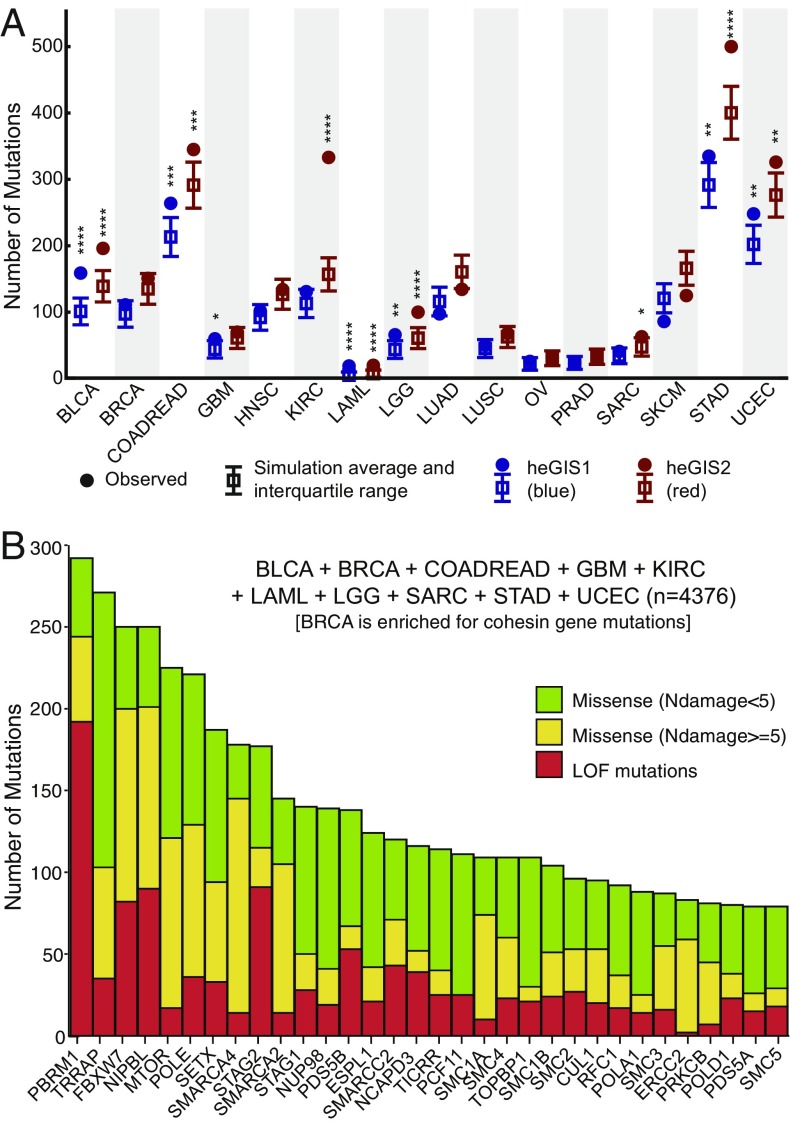
Fig. 4.
Analysis of TCGA data for mutations in human homologs of S. cerevisiae eGIS genes. (A) Summary of the simulations to determine whether human homologs of the eGIS1 and eGIS2 genes are significantly mutated in cancers sequenced by the TCGA. Solid circles are the observed number of loss-of-function and missense mutations for the heGIS1 and heGIS2 gene lists. The box and whiskers correspond the average and interquartile range from the in silico simulations. Statistically significant P values are indicated by the number of asterisks (4 = P < 0.0001, 3 = P < 0.001, 2 = P < 0.01, 1 = P < 0.05). All significant P values were above a false-discovery rate of 0.05 as determined by the Benjamini-Hochberg procedure. (B) Count of the number of mutations in the top 50 mutated heGIS2 genes from the 9 cancers with significant levels of mutations and BRCA, which is enriched for cohesin gene mutations.

