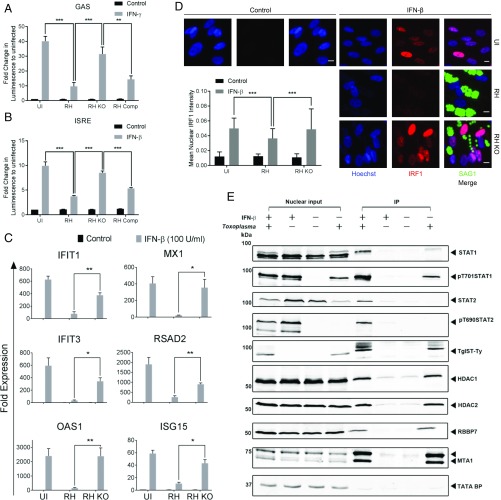
Fig. 1.
TgIST suppresses the type I IFN response. Luminescence is reported in HeLa cells expressing GAS (A) or ISRE (B) Gaussia Luciferase reporter constructs with and without (Control) incubation with IFN-γ (A) or IFN-β (B) at 100 units/mL for 6 h. The cells were left uninfected (UI) and infected with wild-type RH or RH KO (RH strain with knockout of TgIST) for 12 h. Luminescence is expressed as fold change ± SEM, compared with uninfected and control cells from 3 independent experiments done in triplicate. There were significant differences between the compared groups (**P = 0.0002 and ***P < 0.001 using an unpaired Student’s t test). (C) Real-time PCR showing fold induction of mRNA transcripts in HFFs infected with RH or RH KO for 12 h, followed by treatment with IFN-β (100 units/mL for 6 h). Comparative cycle threshold values were used to evaluate the fold change in transcripts using YWHAZ as an internal transcript control. Data are plotted as fold change ± SEM compared with UI and untreated (Control) cells from at least 3 independent experiments per gene. There were significant differences between the compared groups (*P < 0.05 and **P < 0.01 using a multiple Student’s t test with Holm–Sidak correction). (D) Representative images showing nuclear localization of IRF1 in HFFs infected with wild-type RH or RH KO for 6 h, followed by treatment with IFN-β (100 units/mL for 12 h). UI and untreated HFFs were used as controls. The cells were stained using a mAb against IRF1 (red) and Hoechst (100 ng/mL) to label the nuclei (blue), and parasites were detected using mAb DG52 (SAG1) (green), followed by secondary antibodies. (Scale bars, 10 μm.) The bar graph shows the mean of nuclear IRF1 intensity per image (arbitrary units) ± SD of at least 150 images per sample from a representative experiment. There was a significant difference between compared groups (***P < 0.0001 using 2-way ANOVA with Tukey’s multiple comparison test). (E) Western blot analysis of TgIST-Ty immunoprecipitated from nuclear lysates of HFF cells. Cells were either left uninfected or infected with Toxoplasma (RH or RH KO, each expressing Ty-tagged TgIST) for 16 h, followed by treatment with IFN-β (150 units/mL) for 1 h. Control cells were left untreated. Different proteins were probed for their relative enrichment across samples in the immunoprecipitated fraction. Equal amounts of nuclear lysates used for immunoprecipitation are loaded alongside as nuclear input controls. IP, immunoprecipitation.

