Fig. 4.
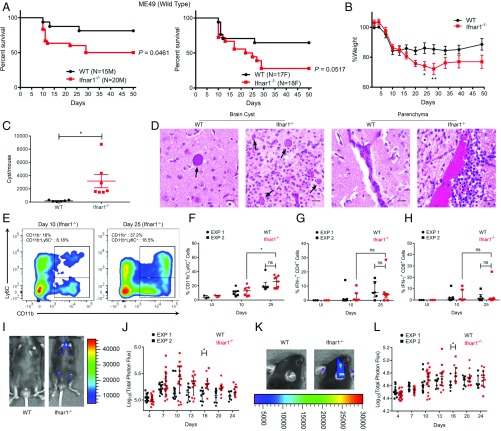
Type I IFN controls in vivo expansion of acute and chronic Toxoplasma infection. (A) Kaplan–Meier curve showing survival of wild-type (n = 15 male [M] and 17 female [F]) and Ifnar1−/− (n = 20 M and 18 F) mice infected orally with 5 cysts of the type II ME49 line expressing firefly luciferase (ME49/FLUC) strain. Cumulative data from 3 independent replicates are shown separately for M and F mice. Statistical difference between wild-type and Ifnar1−/− mice was calculated using a log-rank Mantel–Cox test. (B) Percent weight of mice infected compared with average weight of wild-type mice before infection (0 d) is plotted as mean ± SEM from 2 independent experiments (*P < 0.05, using a multiple Student’s t test with Holm–Sidak correction). (C) Cyst burden in surviving mice is plotted as mean ± SEM (*P = 0.0197, Student’s t test). (D) Histopathological fields showing cyst burden and brain parenchyma. Arrows denote tissue cysts. (Scale bars, 20 μm.) (E) Representative fluorescence-activated cell sorting plot showing CD11b+ and CD11b+Ly6C+ cells in Ifnar1−/− mice at 10 d and 25 d postinfection. (F) Percentages of CD11b+Ly6C+ cells after gating on CD45+CD19−CD3− (hematopoietic, non-B/T cells) brain mononuclear cells from 2 independent replicates. Each point represents 1 mouse. EXP, experiment; ns, not significant. Percentages of IFN-γ+ CD4+ T cells (G) and IFN-γ+ CD8+ T cells (H) are shown after gating on a parent population of live CD45+CD19−CD3+CD4/8+ brain mononuclear cells from uninfected or ME49 infected wild-type and Ifnar1−/− mice at 10 d and 25 d postinfection. Bioluminescent imaging of ME49/FLUC infection in the peritoneum (I) and cranium (K) of wild-type and Ifnar1−/− mice is shown. Representative images show radiance from respective sites at day 16. The scatter plot shows total peritoneal (J) and cranial (L) radiance in each mouse across different time points up to 24 d postinfection. Total photon flux is log-transformed and plotted as median ± interquartile range. There was a significant difference between compared groups (*P < 0.05 using a multiple Student’s t test with Holm–Sidak correction). The number of animals per group is indicated.

