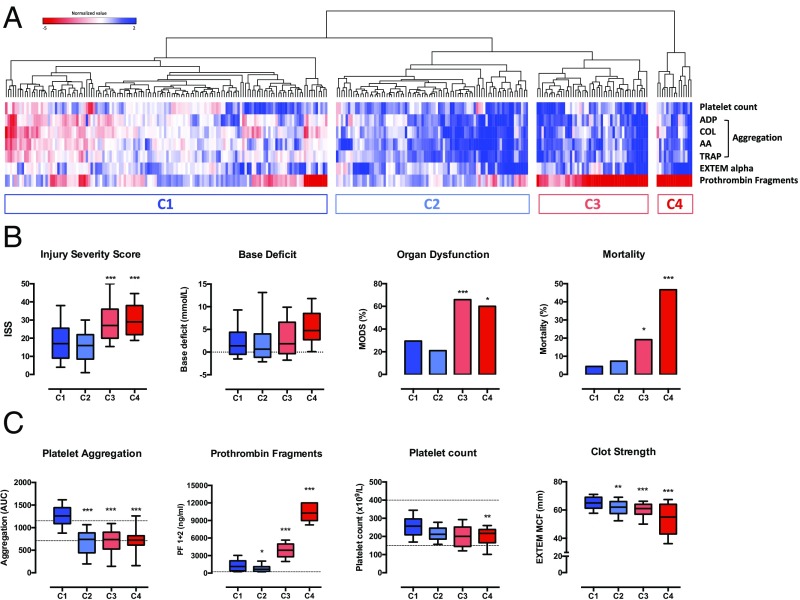
Fig. 1.
Hierarchical clustering analysis of platelet function parameters in trauma patients. (A) Heatmap and dendrogram illustrating 4 major clusters of patients (C1–C4). Each column represents a patient, and each row represents a platelet function parameter. Red cells indicate values which are increased relative to the reference population; blue cells indicate values which are reduced relative to the reference population. (B) Injury characteristics and outcomes in the 4 clusters. (C) Coagulation and platelet function profile in the 4 clusters. Box plots depict median, interquartile range and 10th–90th percentiles. Dashed lines denote normal range. *P < 0.05 **P < 0.01 ***P < 0.001 vs. cluster 1, 1-way ANOVA with Tukey’s posttest for multiple comparisons.

