Fig. 6.
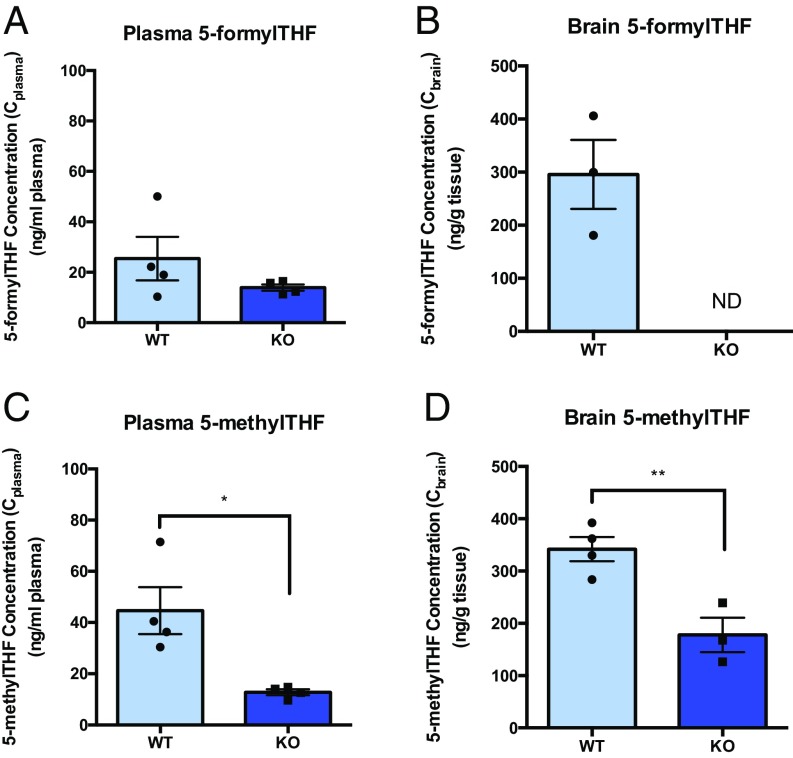
Basal folate levels in WT versus Folr1 KO mice. Plasma and brain concentrations of unlabeled 5-formylTHF (A and B) and 5-methylTHF (C and D) were much lower in Folr1 KO mice compared with WT mice. ND, 5-formylTHF levels in brain tissues of Folr1 KO mice were not detected by LC-MS/MS. Results are presented as mean ± SEM (total of 4 animals per group). Asterisks represent data points significantly different from WT (*P < 0.05; **P < 0.01).

