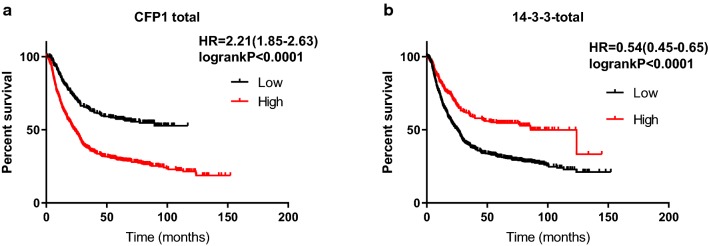
Fig. 5.
Survival curve produced by data obtained by KM-plot. a The survival time of patients with high expression of CFP1 is lower than that of patients with low expression. (P < 0.0001). b Among the patients with high expression of 14-3-3, the survival time is lower than patients with high expression (P < 0.0001)

