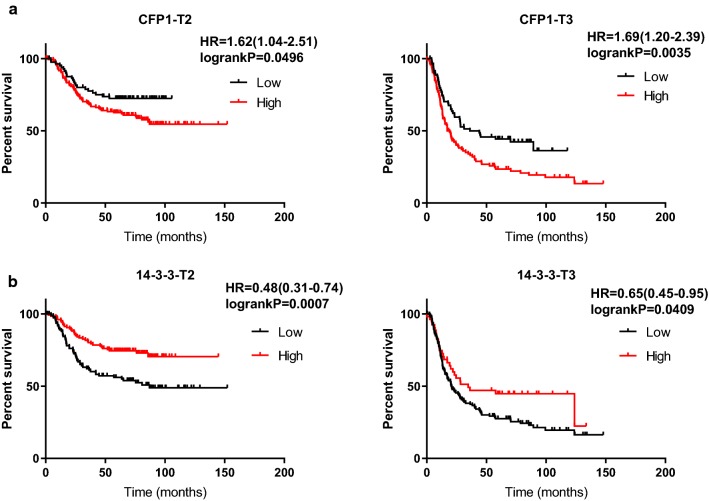
Fig. 7.
Survival analysis of gastric cancer specimens of different stages by KM-plot data. a In T stage, T1 does not have enough data for survival analysis, and we can see the survival time of gastric cancer patients with high expression of CFP1 is short in T2 and T3(P < 0.05). b The survival time of gastric cancer patients with high expression of 14-3-3 is longer in T2 and T3(P < 0.05)

