Fig. 3.

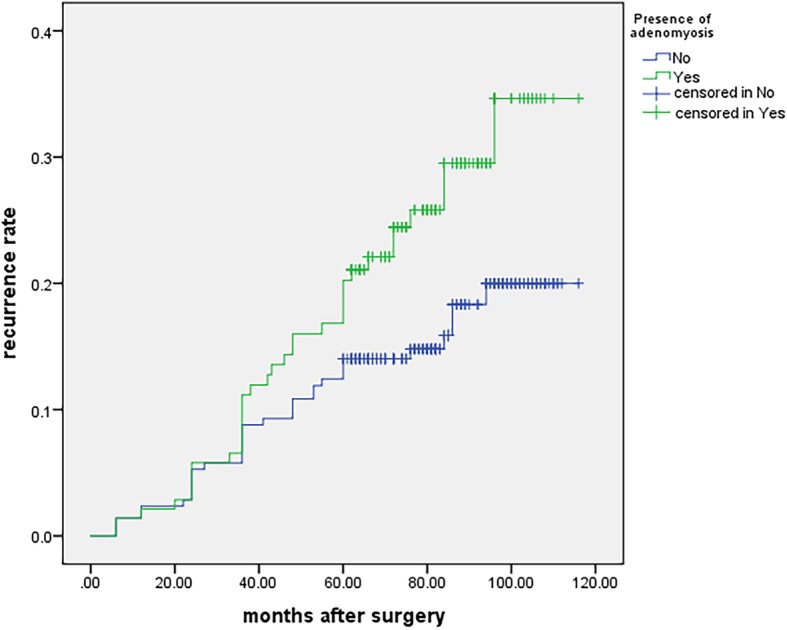
Kaplan-Meier curves presenting the cumulative rate of recurrence according to the presence of adenomyosis. There were significant differences between the two groups according to the log-rank test analysis (χ2 = 4.113, p = 0.043)

Kaplan-Meier curves presenting the cumulative rate of recurrence according to the presence of adenomyosis. There were significant differences between the two groups according to the log-rank test analysis (χ2 = 4.113, p = 0.043)