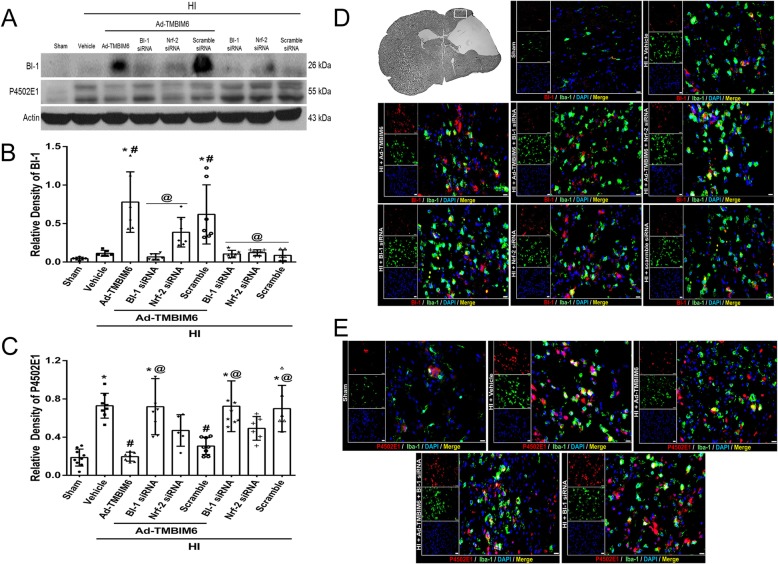
Fig. 4.
The effects of silencing BI-1 on the NPR-CYP complex at 72 h post-HI. Representative bands of western blot data (a). Quantification of western blot bands for BI-1 (b) and P4502E1 (c) (data expressed as mean ± SD; an asterisk indicates p < 0.05 vs sham; number sign p< 0.05 vs vehicle; @ p< 0.05 vs Ad-TMBIM6 or scramble; n = 6/group using one-way ANOVA followed by Tukey’s multiple-comparison post hoc analysis). Immunofluorescence staining of Iba-1 with BI-1 or P4502E1 (d, e). Green was for microglial staining, red was for BI-1 or P4502E1 staining, and blue was for DAPI. Merge (yellow) showed the co-localization of BI-1 or P4502E1 on microglia (scale bar = 50 μm; n = 3/group)

