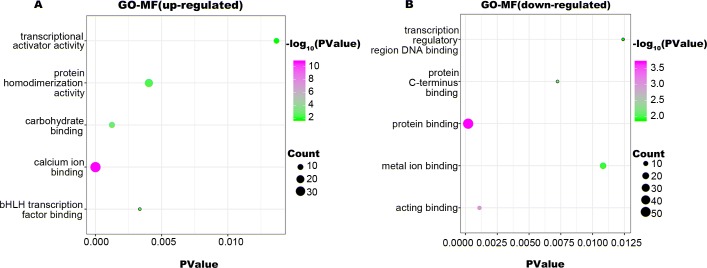
Figure 4. GO-MF function annotation the DEGs.
The up-regulated DEGs were enriched in 22 MF terms, and down-regulated DEGs were enriched in 17 MF terms with a cut-off criterion of count ≥2 and P value <0.1. The gradual color change from green to magenta represents the −log10(PValue) change from low to high, the size of point represents the the count of genes. (A) The top five significantly enriched GO-MF terms for up-regulated DEGs. (B) The top five significantly enriched GO-MF terms for down-regulated DEGs. DEG, differentially expressed genes; GO, gene ontology; MF, molecular function.

