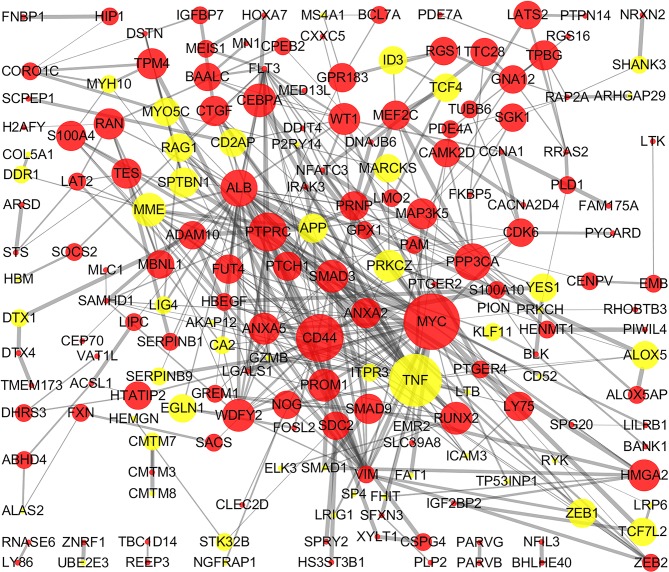
Figure 5. PPI network of DEGs.
The PPI network of DEGs included 297 nodes and 410 edges with minimum required interaction score >0.4 (median confidence). The size of edges change from small to large represents the combined score of nodes change from low to high, the size of nodes represents the count. Red nodes represent up-regulated genes, yellow nodes represent down-regulated genes. PPI, protein–protein interaction; DEG, differentially expressed genes.

