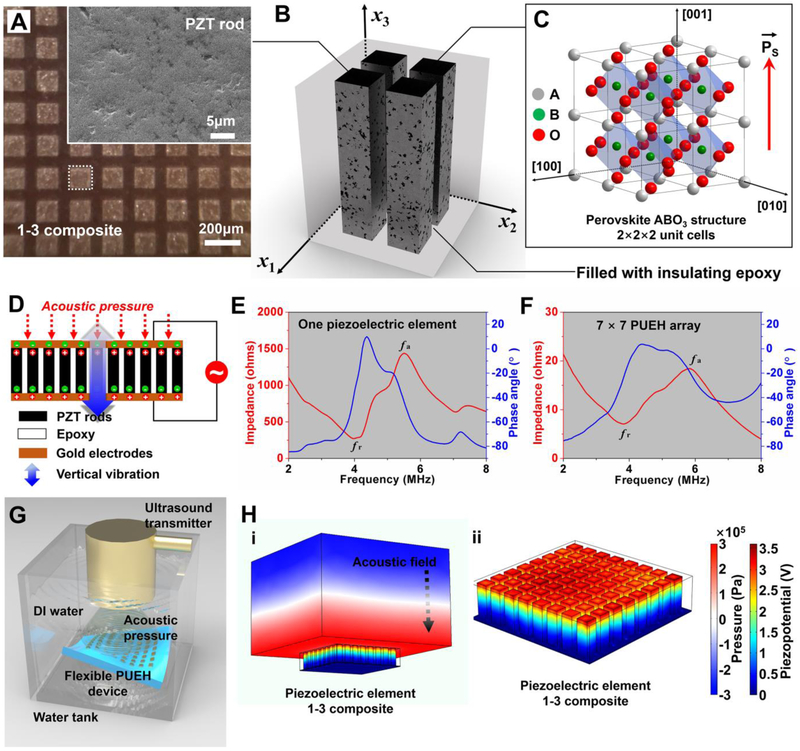
Fig. 2. Characterizations and simulations of the 1-3 composite.
(A) Optical image of the surface of 1-3 composite; the inset shows the SEM image of a piezoelectric PZT rod. (B) Schematic of 1-3 composite. (C) Schematic of perovskite ABO3 structure. (D) The vibration schematic of the 1-3 composite. (E and F) Electrical impedance and phase angle of one piezoelectric element and the 7×7 PUEH device. (G) Schematic of test setup. (H) Simulation results showing the piezoelectric potential distribution inside a composite element driven by acoustic field.

