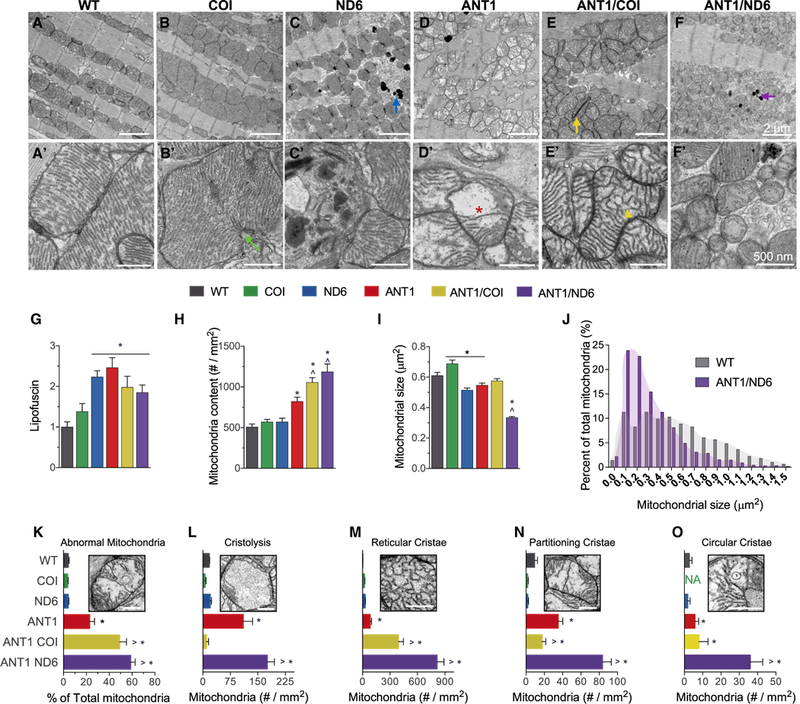
Figure 4. Opposing Effects of mtDNA Variation in Complexes I and IV on Mitochondrial Morphology and Cristae Architecture.

(A-F) Representative electron micrographs of (A-F) ventricular cardiomyocytes and (A’-F’) mitochondria from each nDNA-mtDNA combination (n = 3). Scale bars, 2 μm (A-F); 500 nm (A’-F’). Sarcomeric and mitochondrial alignment in (A) WT and (B) COI versus structural disarray in all other nDNA-mtDNA combinations (C-F). (B and B’) Mitochondrial enlargement in COI myocardium, suggestive of hyperfusion or impaired fission (green arrow; B’). Mitochondrial fragmentation, autophagic vesicles, and lipofuscin accumulation (blue and purple arrows) in (C and C’) ND6 and (F and F’) ANTI/ND6 myocardium. (D-F) Mitochondrial proliferation and (D’-F’) cristae abnormalities, paracrystalline inclusions (yellow arrow; E, ANTI/COI), cristolysis (red asterisk; D’, ANT1), and reticular morphology (yellow arrowhead; E’, ANTI/COI), present in all Ant1-null strains.
(G-I) (G) Quantification of age-related lipofuscin deposits, normalized to WT. Ultrastructural quantification of (H) mitochondrial content and (I) average size per strain (n = 496–1,541).
(J) Percentage distribution of mitochondrial size showing the shift in mitochondrial morphology by the ANTI/ND6 compared with WT.
(K) Percent of abnormal mitochondria counted in each strain.
(L-O) Average number of mitochondria per mm2 with the following most common defects in cristae: (L) cristolysis, and (M) reticular, (N) partitioning, and (O) circular morphologies.
*p < 0.05 versus WT; ^p < 0.001 versus ANT1. Data are represented as means ± SE. See also Figures S3 and S4.
