
Figure 6. Mitochondrial Bioenergetics, ROS Production, and mtPTP Stability in Isolated Cardiac Mitochondria from Six nDNA-mtDNA Genetic Combinations.
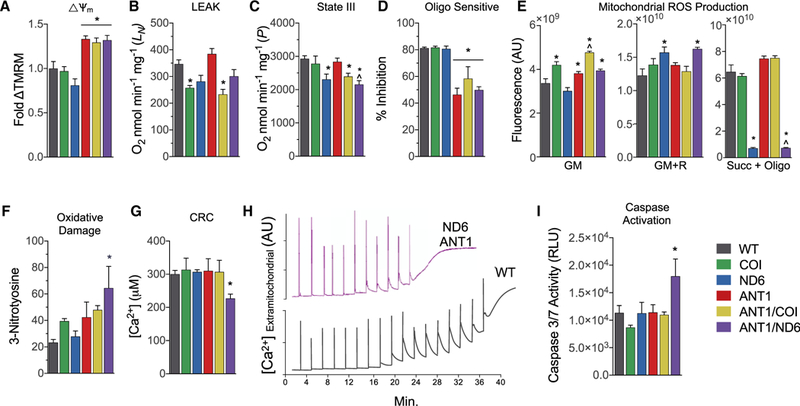
(A) Mitochondrial membrane potential determined bytetramethylrhodamine methyl ester fluorescence respiring on glutamate and malate (GM), graphed relative to WT.
(B) Mitochondrial oxygen consumption rate metabolizing glutamate and malate (GM) in the absence of ADP or uncoupler (state II or LEAK rate).
(C) Mitochondrial oxygen consumption rate metabolizing GM in the presence of ADP (state III or P rate).
(D) Relative inhibition of respiration by oligomycin in mitochondria during state III.
(E) Hydrogen peroxide (H2O2) production detected by Amplex red in isolated mitochondria incubated with GM, rotenone (R), or succinate (Succ) and oligomycin (Oligo).
(F) Nitroxidative damage determined by 3-nitrotyrosine (3NT) protein adducts in heart tissue from 12-month-old mice.
(G) Ca2+ levels required to activate the mtPTP and collapse the mitochondrial membrane potential.
(H) Representative traces of extramitochondrial Ca2+ following 20 μM Ca2+ pulses delivered every 2 min until the spontaneous release of mitochondrial Ca2+, marking the onset of mtPTP opening in WT and ANTI/ND6 mice.
(I) Activation of intrinsic apoptosis determined by effector caspase-3 and −7 activities.
Data are represented as means ± SE. *p ≤ 0.01 versus WT; ^p ≤ 0.01 versus ANT1; n = 3–5. See also Figure S6.