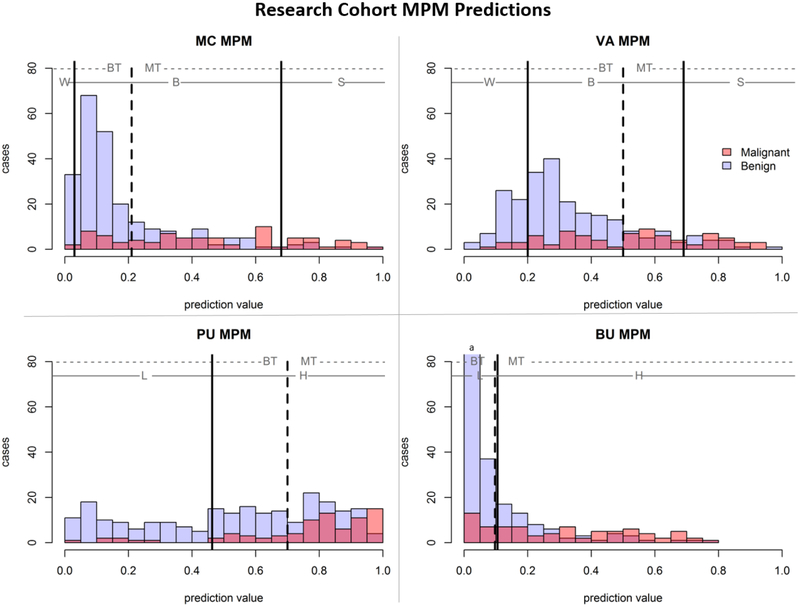
Figure 1 –
Histograms of MPM predictions split based on true nodule classification. Solid lines indicate MPM-derived thresholds with MPM-assigned categories of watchful-waiting (W), biopsy (B), surgery (S), low-risk (L), or high-risk (H). The dashed line indicates cohort AUC-derived threshold for optimal separation of classes, with cases to the left of the line assigned ‘benign-tagged’ and cases to the right of the line assigned ‘malignant-tagged’.

