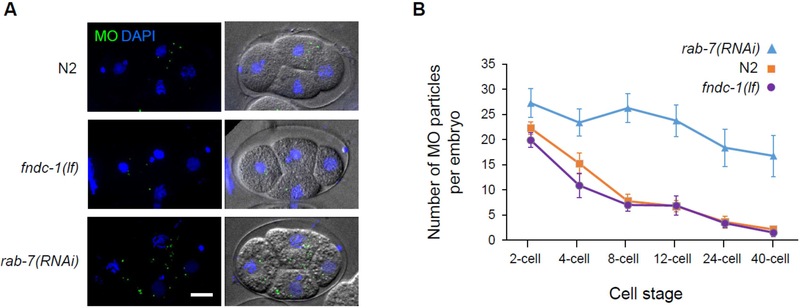
Figure 3 – Membranous organelles are effectively cleared in the absence of paternal FNDC-1.
A No defect in MOs elimination is observed in the absence of FNDC-1 compared to wildtype (N2) embryos. A delay in MOs elimination can be observed in the rab-7(RNAi) embryos. Maximum-intensity Z-stacks projections of fixed embryos. Wildtype (N2), fndc-1(lf) and rab-7(RNAi) 4-cell stage embryos labeled for MOs (green) and stained for DNA (blue) (left panels) and DIC images (right panels) are shown. Scale bar: 10μm.
B Quantification of MO particles per cell stage in wildtype (N2) (purple), fndc-1(lf) (orange) and rab-7(RNAi) (blue) embryos (n=8 embryos per condition). Data shown in the graph corresponds to the mean ± SEM of MOs per embryo.

