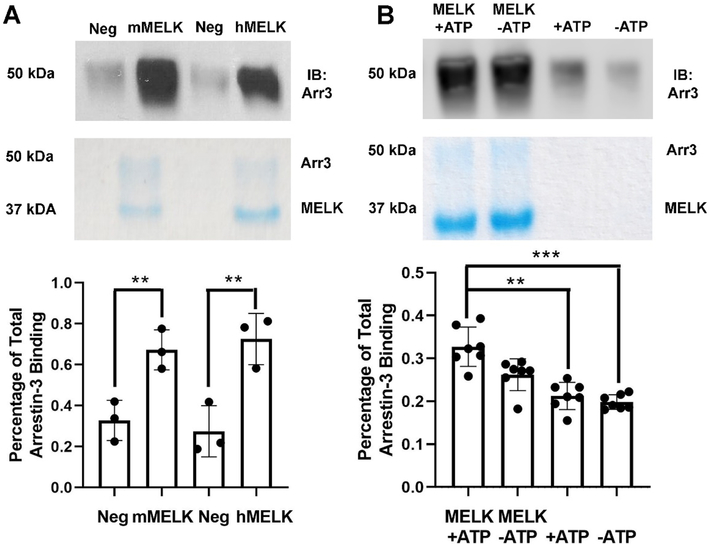
Figure 1. Pull-down of purified MELK1−326,T167E with purified arrestin-31–393.
(A) Analysis of mouse MELK1−326,T167E (10 μg; mMELK) and human MELK1−326,T167E (10 μg; hMELK) binding to bovine arrestin-31−393 (10 μg). Top: Representative Western blot of the eluates using a polyclonal anti-arrestin antibody (1:10,000, F431 [58]). Middle: Representative Coomassie staining of the eluates. Bottom: Quantification of arrestin-3 binding using densitometry. Intensity was compared to the negative control (beads alone) and binding is shown as a percentage of total arrestin-3 applied (n=3). Statistical analysis was performed using Student’s t-test (**, p<0.01). (B) Analysis of human MELK1−326,T167E (10 μg) binding to bovine arrestin-31−393 (10 μg) in the absence or presence of 2 mM ATP and 4 mM MgCl2. Top: Representative Western blot of the eluates using an anti-arrestin-3 antibody (1:10,000, F431). Middle: Representative Coomassie staining of the eluates. Bottom: Quantification of arrestin-3 binding using densitometry. Intensity was compared to the negative control (beads alone) and binding is displayed as a percentage of total arrestin-3 applied (n=7). Statistical analysis was performed using Kruskal-Wallis test with multiple comparisons (**, p<0.01; ***, p<0.001).

