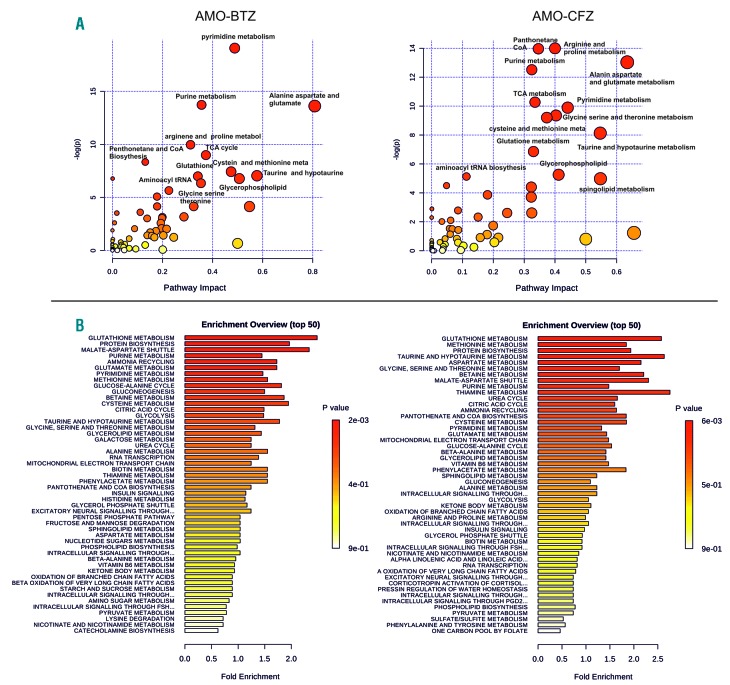
Figure 1.
Pathway analysis and metabolite set enrichment analysis of proteasome inhibitor-adapted multiple myeloma cells (AMO-BTZ and AMO-CFZ). (A) Metabolite pathway analysis of deregulated metabolites in AMO-BTZ (aBTZ) and AMO-CFZ (aCFZ) cells compared to AMO-1 cells. The metabolic pathways are represented as circles, according to their scores from enrichment (y axis) and topology analyses (pathway impact, x axis) using MetaboAnalyst 3.0. Darker red colors indicate more significant changes of metabolites in the corresponding pathway. The size of the circle corresponds to the pathway impact score and is correlated with the centrality of the involved metabolites. (B) Metabolite set enrichment analysis pathway overview in AMO-BTZ and AMO-CFZ, in comparison with AMO-1 proteasome inhibitor-sensitive cells obtained by MetaboAnalyst 3.0. Over-representation analysis was implemented to evaluate whether a particular metabolite set was represented (fold enrichment) more than expected by chance within the given compound list. One-tailed P values are provided after adjusting for multiple testing. TCA: tricarboxylic acid; CoA: coenzyme A.

